Sergey Diakov

Tesla appears to be forming a base after a recent pullback, with price reacting around the $338 level and attempting to move higher. In a recent analysis, Alex suggested this area may mark a local bottom, with TSLA now likely to test the upper resistance of its downtrend channel. The setup remains bearish overall, but early signs of structure development are emerging.
The TSLA Downtrend Channel Still Governs Price
The chart clearly shows Tesla trading within a descending channel, defined by lower highs and consistent rejection near the upper boundary. This structure continues to frame price action, indicating that the broader trend has not yet reversed.
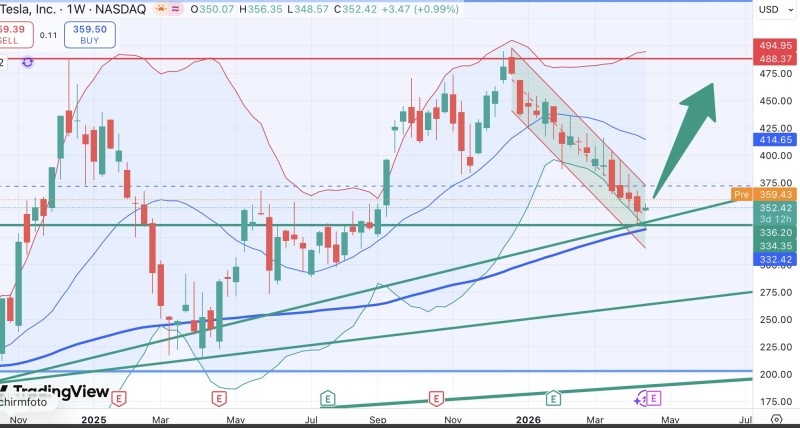
Recent movement reflects a pullback into the lower part of the channel, followed by a reaction higher. This aligns with typical behavior inside a bearish channel, where price oscillates between support and resistance rather than trending cleanly. Tesla Holds $400 Support Trendline as Wedge Pattern Forms - similar technical setups have been observed where Tesla remained in correction while trading below key resistance zones, reinforcing the importance of channel structure in defining direction.
Why the $338 Level Stands Out for Tesla
The $338 area marks the recent reaction low and aligns with the lower boundary of the channel. This level is now acting as a reference point for short-term structure.
This zone is highlighted as a potential bottom, and the chart confirms that price has stabilized there rather than breaking lower. The idea of price holding near support before testing higher levels is consistent with prior Tesla setups where key support zones triggered consolidation phases. TSLA Stock Stays in Correction Below $418.86 Resistance - prior correction phases show how resistance levels shape Tesla's medium-term trajectory.
A Move Toward TSLA Resistance Is Now in Focus
Following the bounce from $338, price is positioned to test the upper boundary of the descending channel. This is the next logical step within the current structure.
However, the broader trend remains bearish, and a breakout is unlikely to happen immediately. The channel has repeatedly capped price, and another rejection from resistance would keep the structure intact. TSLA Forecast Extends to $900+ as Tesla Shows Phase 4 Momentum Shift - longer-term projections suggest that once this channel resolves, the upside potential could be substantial.
The Structure Shifting Beneath the Surface
While the trend remains downward, the formation of a higher low introduces a subtle shift in structure. This does not invalidate the channel, but it suggests that selling pressure may be weakening.
If price continues to build on this higher low, it creates the foundation for a broader base. Over time, this type of structure can support a move toward higher highs, aligning with the idea of a larger upside progression into 2026. Longer-term Tesla patterns have previously shown that consolidation phases within broader structures can eventually resolve into stronger upward moves when support holds.
Consolidation phases within broader structures can eventually resolve into stronger upward moves - the question is whether $338 holds long enough to build a meaningful base.
For now, TSLA remains within its channel - stabilizing at support, but still facing resistance above.
 Sergey Diakov