 Sergey Diakov
⬤ Tesla (TSLA) pushed higher again this week, catching eyes with a new long-term technical picture that suggests the stock might be gearing up for a stronger run. TSLA is now being viewed as a top contender for the biggest gains among major large-cap tech names heading into the end of 2026. The chart shows Tesla trading around $429, sitting just below key structural resistance that's held price in check for over a year.
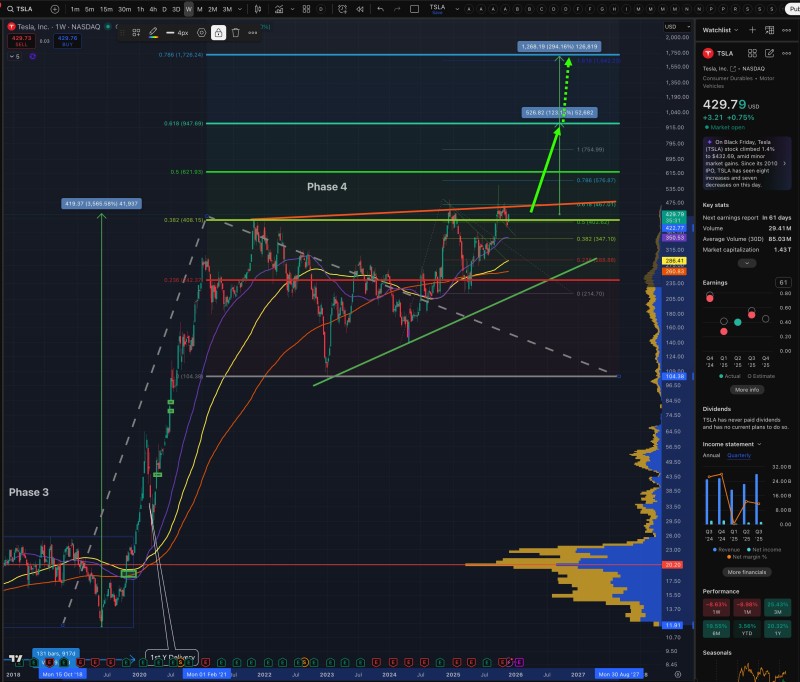
⬤ The setup lays out a multi-year Fibonacci framework, with Phase 3 marking the previous major rally and Phase 4 representing the current consolidation zone. Price is sitting right under the 0.618 and 0.786 Fibonacci retracement bands, with potential extension targets sketched out above $900 and further projections pushing past $1,200. Tesla has been respecting an ascending support trendline and holding above clustered moving averages, pointing to sustained upward momentum within the broader range. Volume profile data shows heavier trading activity in the lower parts of the multi-year structure, lining up with recent accumulation areas.
⬤ A breakout above the long-standing horizontal boundary could open the door toward higher Fibonacci expansion zones if momentum holds. The chart maps out 2024 through 2026 as the window for this structure to play out, with the outlined path moving from the top of Phase 4 toward long-term retracement milestones. While nothing's guaranteed, the visual setup shows how TSLA's multi-year trend has stayed intact, with each major consolidation eventually resolving higher in previous phases.
⬤ This matters because Tesla remains one of the most-watched stocks in the large-cap growth space, and extended consolidation patterns can shape both sentiment and long-term expectations. The combination of rising trend support, multi-year Fibonacci markers, and a maturing Phase 4 pattern highlights how long-term positioning could continue driving the conversation around Tesla's path into 2026.
 Sergey Diakov


