 Eseandre Mordi

⬤ Tesla shares have lost roughly 24% from recent highs, with selling pressure keeping the trend firmly negative. According to MCO Global, the chart structure remains overlapping and corrective, with no confirmed reversal in sight.
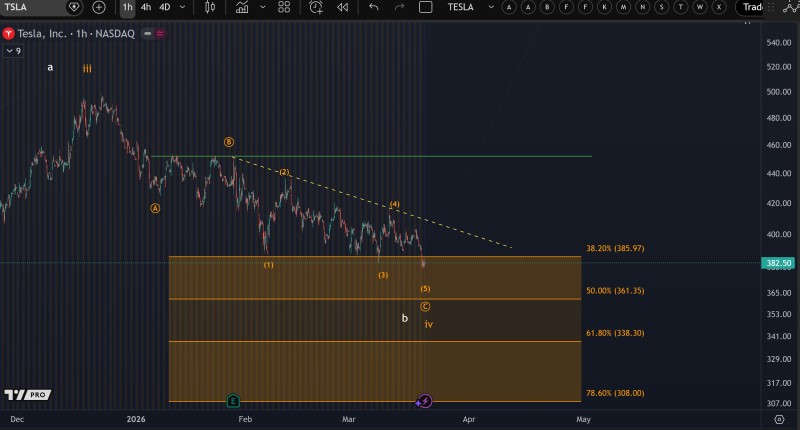
⬤ The technical picture shows a clean sequence of lower highs and fading momentum inside a descending structure. Fibonacci retracement levels put the 38.2% zone near $385 as the most recent reaction point, where TSLA briefly stalled before resuming the slide. The stock continues to fail at reclaiming key resistance, keeping the broader downtrend intact.
⬤ The next level traders are watching is $361, which lines up with the 50% Fibonacci retracement and a significant horizontal support area. A confirmed break below that zone opens the door to $338 and potentially $308. For any change in outlook, Tesla Faces Critical $404-$409 Resistance After 3-Month Downtrend showed how $417 remains the decisive upside level - only a reclaim there would invalidate the corrective read.
⬤ Recent coverage underlines how TSLA keeps oscillating between defined zones without breaking free. Tesla Stock Reclaims $400 Support: Can TSLA Hold Critical Trendline and TSLA Stock Analysis: Tesla Trades Near $412 Support as Channel Holds both captured the same push-and-pull dynamic, with sentiment remaining mixed across timeframes.
⬤ Until price action stabilizes above key resistance, the corrective phase appears unfinished. Downside risk stays tied to how well the $361 support area holds. A clean bounce from that level could set up a base, but confirmation above $417 is what bulls need to change the narrative.
 Eseandre Mordi


