Saad Ullah

SOFI has built a firm base near $15, with buyers repeatedly stepping in and stopping further downside. The chart shows price pushing back into the EMA cloud, and the next reaction at that level will define the broader structure. Fibby. pointed out that the key signal is not the initial move higher - but whether the next pullback produces a higher low or breaks beneath the base.
SOFI is no longer trending cleanly lower, but it has not yet proven that a new uptrend is in place. The structure is improving, but confirmation depends entirely on how price behaves after testing the EMA cloud.
The key signal is not the initial move higher - but whether the next pullback forms a higher low or breaks lower.
SOFI Base at $15 That Changed the Tone
The chart clearly shows a bottom forming around the $15 level, where price found support on multiple occasions. That area has held firm, allowing the structure to shift from a sustained decline into stabilization. Price has since moved higher from that base - which is the first requirement for any potential trend change.
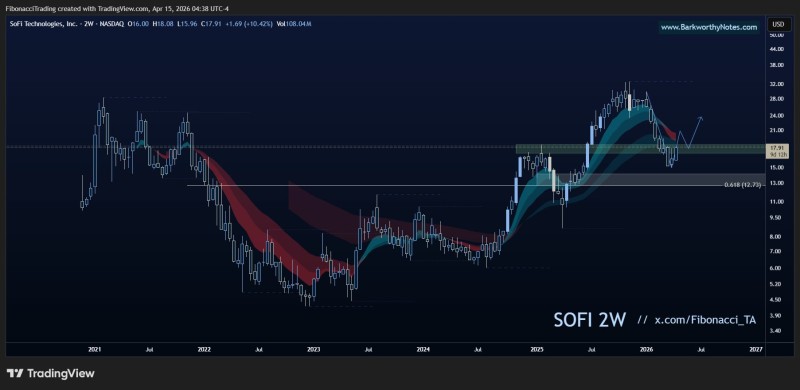
But the move is not confirmed yet. At this stage, the chart shows a recovery from support - not a completed reversal. There is a meaningful difference between the two, and traders positioning around SOFI right now are navigating exactly that gap. SOFI Stock Anchored at $16 as Dark Pool Battle Over 116 Million Shares Intensifies offered a closer look at the institutional activity around this range.
SOFI Stock Runs Into EMA Cloud Resistance
Following the bounce, price is now interacting with the EMA cloud on the two-week chart - a zone that acts as dynamic resistance. The setup does not confirm a breakout at this point. It only shows price testing that region and waiting for a response.
A rejection at the EMA cloud would keep the structure unresolved. A clean move through it would strengthen the case for a broader shift in trend.
That is exactly why this zone matters - it is the first real test of whether buyers are genuinely taking control or simply staging a counter-trend bounce. SOFI Stock Falls 50% as SoFi Technologies Resets Valuation at $17.37 provides useful context on the broader decline that preceded this setup.
The SOFI Pullback Will Tell the Story
The most important signal comes after the EMA cloud test. What happens on the retracement matters far more than the initial bounce off $15. Two scenarios define the outcome:
- A lower low would keep the broader structure bearish
- A higher low within the demand zone would support a bullish transition
That distinction is central to the setup. The current advance alone is not enough. Price needs to prove it can hold during a retracement before the trend shift carries any real weight. SOFI Stock Breaks Down as SoFi Technologies Loses Momentum Near $24 traces how the stock arrived at this point in the first place.
 Saad Ullah