Alex Dudov
SOFI is sitting at a critical inflection point where options flow - not price alone - is shaping the narrative. Large traders are stacking positions across both bullish and bearish strikes, and the setup reflects a market where conviction exists on both sides, but direction remains unresolved. For broader context on how institutional activity has been clustering near these levels, SOFI Stock Anchored at $16 as Dark Pool Battle Over 116 Million Shares Intensifies highlights similar concentration patterns playing out in parallel.
The SOFI Call Side That Built Momentum
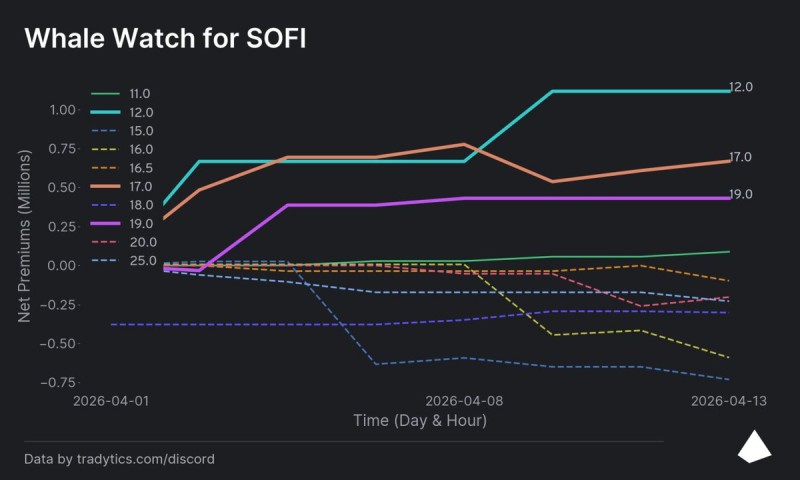
As options analyst Fibby. noted, call positioning has concentrated heavily at key strike levels, with the $12 calls leading at approximately $1 million in net premium. These deep in-the-money positions have held steady over the past week, pointing toward a stock-replacement strategy rather than active expansion.
Call positioning has concentrated heavily at key strike levels, with $12 calls leading at approximately $1 million in net premium - these deep in-the-money positions have remained stable, suggesting a stock-replacement strategy rather than active expansion.
Further up the chain, the $17 calls saw a sharp increase toward roughly $600K mid-week before pulling back, while $19 calls continue to build more gradually, reaching around $400K. This creates a layered call structure - but without consistent upward acceleration to confirm a breakout bias.
The SOFI Put Flow That Never Left
While calls show bursts of activity, the put side has remained consistently active throughout the entire period. The chart highlights a steady decline in net premiums across key strikes, reflecting ongoing bearish positioning:
- $15 puts near -$650K
- $16 puts around -$500K
- $18 puts near -$300K
This is not a short-term spike but a sustained trend over two weeks, reinforcing the idea that downside exposure has not been unwound - even as call structures expanded.
This kind of persistence is worth noting. When bearish positioning holds its ground while bullish flows are also building, it typically signals an approaching inflection rather than a calm market grinding in one direction. SOFI Stock Shows Signs of Stabilization Near $15-$16 as Downtrend Loses Steam explores how positioning and support zones have recently started to shift within this same range.
SOFI Options Market Locked Between Competing Flows at $17
With SOFI stock at approximately $17.05, price sits directly within the most contested strike zone. The options structure shows both sides actively building, with neither stepping back. The current setup breaks down as follows:
- Deep ITM calls remain dominant but unchanged
- Mid-range calls fluctuate without continuation
- Higher strike calls build gradually
- Put positioning continues to expand steadily
The options market is not signaling resolution - it is signaling tension. This combination suggests a balance of pressure rather than a directional edge.
This kind of structure often precedes a decisive move, but for now, the chart reflects a market where both bullish and bearish participants are holding their ground. SOFI Stock Analysis: Support Hold at $16-$19 Could Trigger Move to $28 focuses on the same price range acting as a structural pivot - and what a resolution higher could look like from a technical standpoint.
 Alex Dudov