 Saad Ullah

⬤ Oracle's stock has dipped back to a key support area after a sharp drop, and the long-term chart shows this isn't the first time. The current setup looks a lot like what happened before—ORCL breaks out, pulls back to retest that breakout level, then climbs again. Right now, the stock is sitting in that same zone that's acted as a springboard in past cycles.
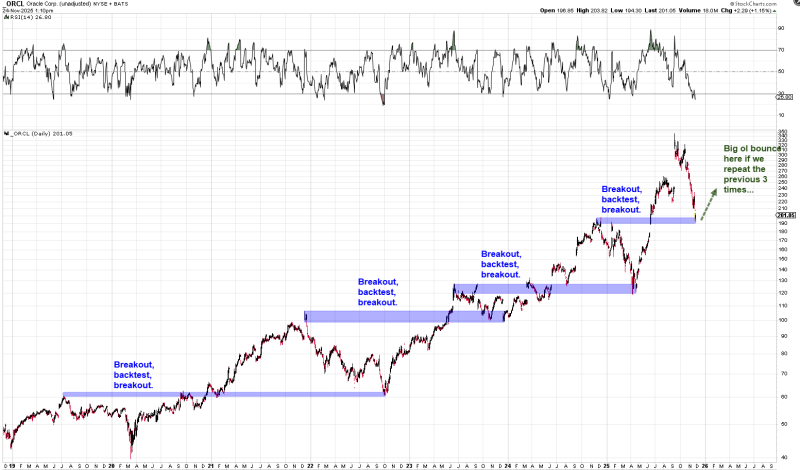
⬤ The chart shows three previous times when Oracle broke above resistance, came back down to test that level, and then pushed higher. Each time, that retest created a stable base before the stock started moving up again. ORCL is now trading near the low $200 range, right where that horizontal support sits. The RSI indicator is also hovering near lower levels, similar to earlier moments when the stock paused before bouncing back.
⬤ Oracle recently hit around $201 after dropping from its highs, and based on the chart pattern, this could be the point where a rebound typically shows up. There's no guarantee it'll play out the same way this time, but the technical setup definitely matches what we've seen in the last three cycles.
⬤ This matters because Oracle has a track record of following these repeating patterns during big market swings. If the stock bounces from here, it would back up the broader trend and give ORCL bulls more confidence. But if it breaks below this level, that would be a departure from its usual behavior and might hint at a shift in momentum heading into 2026.
 Saad Ullah


