Saad Ullah

⬤ ORCL is back in focus after a textbook head and shoulders pattern played out on the weekly chart heading into 2026. The breakdown from this formation drove the bulk of the bearish move seen in recent months, with the neckline and shoulder levels marking the key boundaries of the decline.
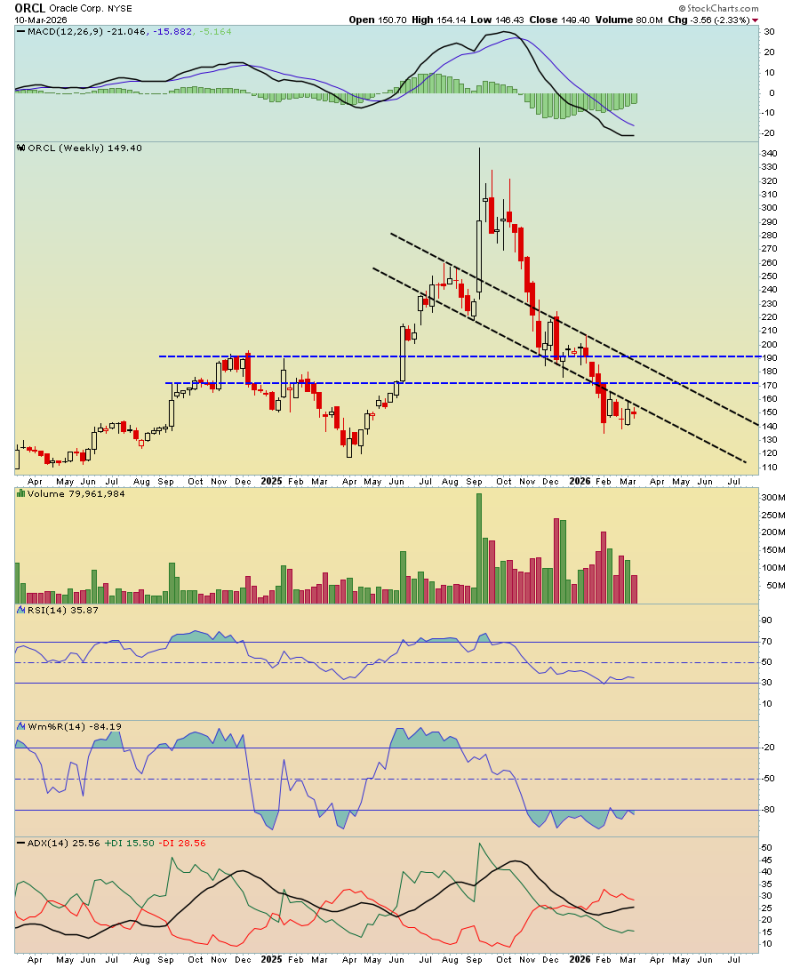
⬤ After hitting significantly higher levels, ORCL rolled into a descending channel defined by lower highs and persistent selling pressure. The stock is now testing a technically important zone between $171 and $191, highlighted as a potential long-term base on the chart.
⬤ This $171-$191 range is viewed as a structural decision point. A confirmed move above the $191 upper boundary would signal a meaningful trend reversal. Without that confirmation, the corrective structure inherited from the head and shoulders breakdown remains intact. Related analysis covering ORCL Stock Tests $277 Support as Buy Signals Emerge and Oracle Stock Watch: TikTok Speculation Drives Pivotal $300 Test explored earlier inflection points in ORCL's price history.
⬤ Head and shoulders patterns are among the most closely followed reversal signals in technical analysis, and their aftermath often shapes price action for months. As ORCL consolidates near this zone, Oracle Stock Options See Heavy Action Ahead of $310 Strike provides broader context on how options markets have priced key resistance levels. The $191 threshold remains the line to watch for any shift in ORCL's long-term trajectory.
 Saad Ullah