 Marina Lyubimova

⬤Nvidia is approaching a critical technical level near the $161 yearly pivot. After consolidating in the $170-$173 range following a strong uptrend, price action is starting to soften. The 100-week moving average sits near $145-$146, offering longer-term support if selling pressure picks up.
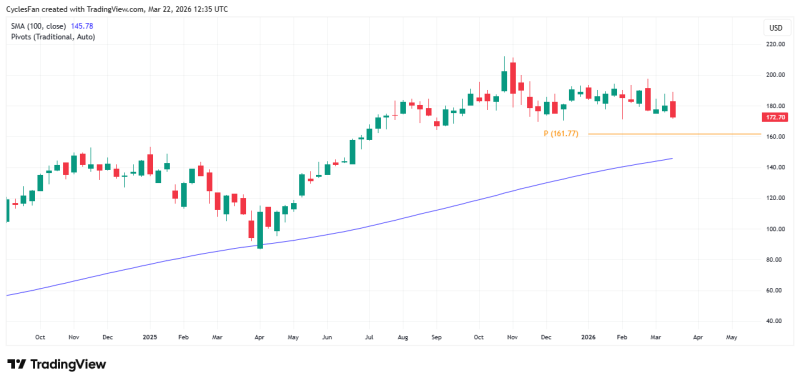
⬤The broader chart structure confirms Nvidia remains inside an uptrend, but recent candles tell a different story. Price has failed to hold above $180 and is drifting lower. The $161.77 pivot lines up with prior consolidation zones, making it a level worth watching closely. Historical setups in NVDA Risks Breakdown Below $167 Support showed similar dynamics before meaningful directional moves.
⬤A confirmed break below $161 would point toward the 100-week MA around $146 as the next downside target. That gap between current price and the moving average suggests the move could be sharp if sellers gain control. NVDA Stock Analysis: Critical Support Level at $166 previously noted how losing major support zones tends to shift momentum quickly.
⬤NVDA is now at a decision point. How price reacts around $161 will likely decide whether this consolidation turns into a trend continuation or a deeper correction. Traders tracking the NVDA Stock Breaks Out With Strong Volume Surge breakout may reassess risk if the $161 floor fails to hold.
 Marina Lyubimova


