 Marina Lyubimova

⬤ Nvidia is approaching a technically significant level as price action develops within a broadening pattern on the weekly chart. The structure shows expanding price swings drifting toward a well-defined support zone at $167. As analyst The Great Martis notes, this is a decisive threshold where downside risk rises sharply if the level gives way.
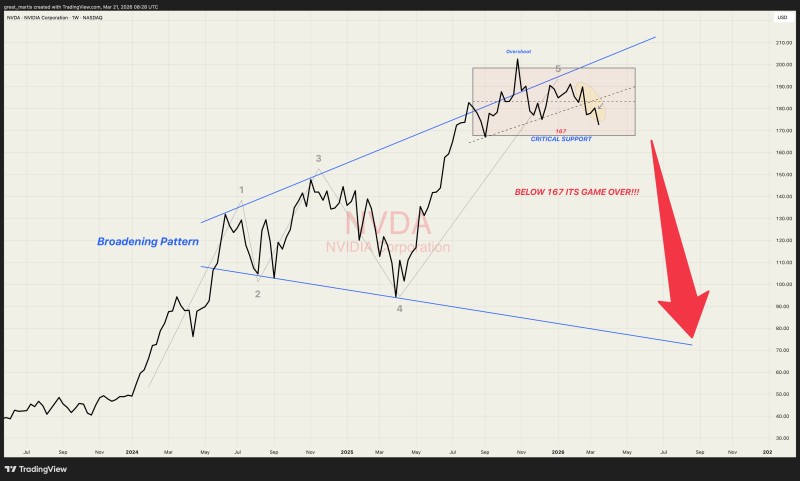
⬤ The chart shows a multi-wave structure inside the broadening formation, with price recently consolidating after pushing toward the upper boundary. The $167 zone has acted as a key reference point in earlier setups too. NVDA News: Nvidia Targets $230 as Chart Highlights $167 Support Retest identified $167 as a primary support zone capable of determining the next directional move.
A move below $167 would signal a loss of structural support, opening the path for a deeper decline.
⬤ Holding above $167 keeps NVDA within the broader range and preserves room for stabilization. A break below, however, removes that structural floor entirely. NVDA and NASDAQ Charts Show Warning Signs at Critical $167 Resistance Level ties broadening patterns directly to elevated volatility and accelerated downside when key levels fail.
⬤ NVDA sits at a clear inflection point. How price reacts at $167 will likely set the tone for the next phase of the move. NVDA Stock Tests Critical Support After Recent Pullback confirms that losses below this zone have historically triggered extended downside runs, reinforcing its importance to near-term sentiment.
 Marina Lyubimova


