 Eseandre Mordi

⬤ NVDA and the Nasdaq Composite have reached a precarious technical moment as both trade near long-term resistance after their impressive run since 2023. Both charts are displaying a broadening pattern—a formation known for its expanding price swings that typically shows up late in market cycles. Right now, prices are stalling near the upper boundaries of these patterns after years of steady gains.
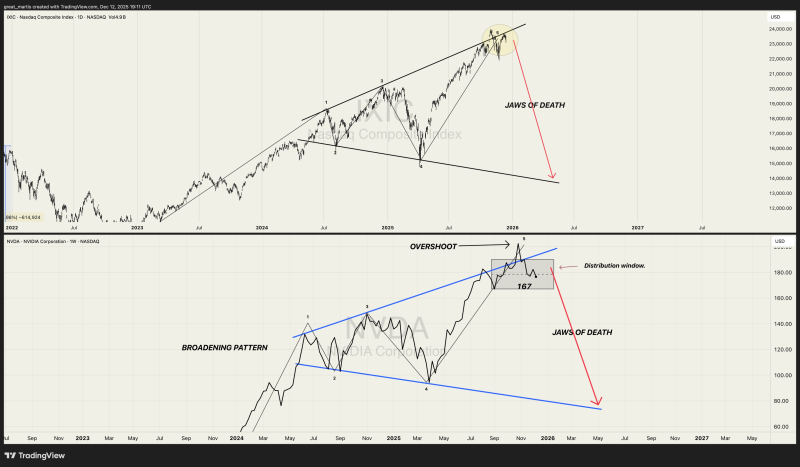
⬤ The Nasdaq's chart tells an interesting story. It's been climbing within this expanding structure, making higher highs but also experiencing deeper pullbacks along the way. The index is currently testing the upper edge of this formation, but momentum seems to be fading. What's concerning is the pattern of repeated attempts to break higher that couldn't stick, followed by sharp drops back down. This kind of back-and-forth action at elevated levels usually means the market is getting shakier.
The widening swings visible on the chart are consistent with a broadening pattern, while downside projections become active if the lower trend boundary is breached.
⬤ NVDA's weekly chart mirrors this setup almost perfectly. After its powerful surge through late 2024 and into early 2025, the stock hit a consolidation zone near that upper trendline around the $167 mark. Instead of pushing decisively higher, price action has turned choppy—a sign that distribution might be happening at these levels. The expanding swings match the classic broadening pattern, and the chart shows where things could head if support at the lower boundary gives way.
⬤ NVDA has basically been the engine driving Nasdaq's entire bull run. When a market leader like this starts consolidating in an expanding pattern, it often means the whole market is about to get less stable. If these key technical levels don't hold, we could see increased selling pressure that would impact broader market sentiment. The next few price moves will be crucial for determining what comes next.
 Eseandre Mordi


