Alex Dudov
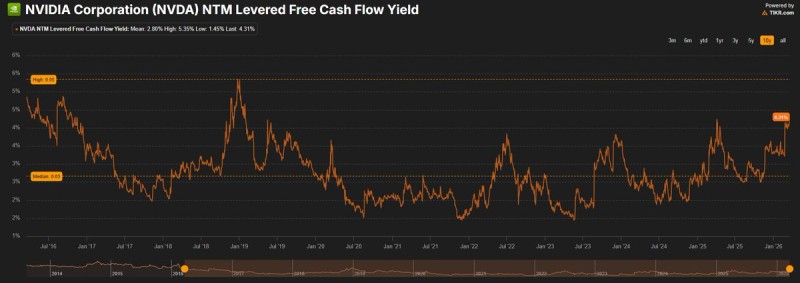
NVIDIA's next-twelve-months leveraged free cash flow yield has crossed above 4% again, landing at approximately 4.31%. Based on chart data going back six years, this level has only been reached four times -- making the current reading an unusually elevated signal.
Only 4 Times in 6 Years: What the 4.31% Reading Actually Means
The previous three instances each coincided with distinct macro events: early 2020 before Covid-driven market disruption, June 2022 when U.S. inflation hit 9.1%, and April 2025 during the so-called Liberation Day market episode. Most of the time, NVDA's free cash flow yield has clustered near the median around 3%, with the historical range running from roughly 1.45% at the low end to a peak near 5.35%. The current 4.31% puts it firmly in the upper part of that band -- elevated, but not yet at prior extremes.
From $216M to $26.2B: NVIDIA's Cash Machine Behind the Valuation Signal
Part of what makes this reading significant is the company it reflects. Over the past decade, Nvidia's free cash flow grew from $216 million to $26.2 billion -- a scale shift that reframes what a 4% yield actually represents in dollar terms. Nvidia's Free Cash Flow Jumps from $216M to $26.2B Over 10 Years captures exactly that transformation.
When the yield moves toward the upper end of its historical range, it signals that price and cash generation dynamics are shifting into less common territory. Whether that reflects a buying opportunity or broader caution depends on context -- but the pattern is consistent: NVDA tends to trade in recognizable valuation cycles shaped by both its own performance and macro conditions. Forward projections reflect that momentum, as explored in Nvidia Trades at 25x Forward Earnings With $150B+ Cash Flow Projection.
 Alex Dudov