 Usman Salis
Nvidia is flashing a classic technical exhaustion signal after its daily close beneath the lower Bollinger Band. According to SmartReversals, the move reflects a stretched condition rather than a confirmed breakdown - a distinction that carries significant weight given how similar setups have resolved in the past. The pattern places NVDA at a short-term inflection point where the next session may define the outcome.
NVDA Bollinger Band Break Mirrors 3 Prior Exhaustion Signals
The daily chart tells a familiar story. Each time NVDA has pushed below the lower Bollinger Band, a quick snap back into the range has followed. The April 2025 flush is one of the clearest examples - price extended aggressively below the band before recovering just as sharply.
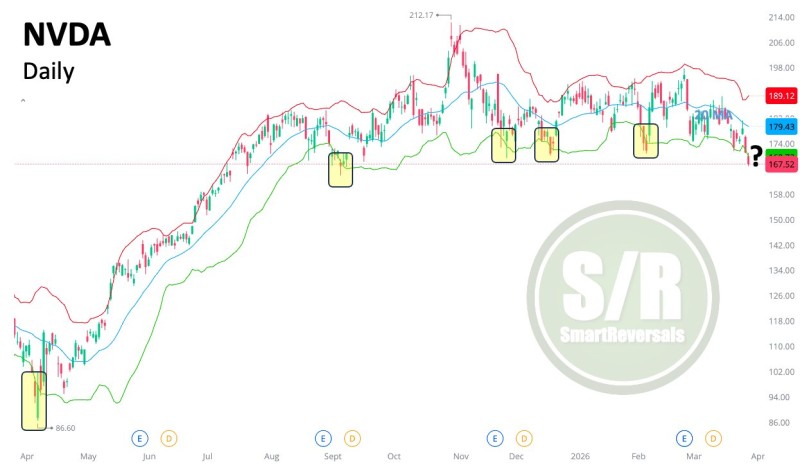
The current close outside the band reflects a stretched condition rather than a confirmed breakdown. Historically, such moves have not sustained.
The current setup mirrors those prior instances closely. Downside momentum may already be exhausted - the question is whether buyers respond immediately or allow the move to linger.
$168.5 Is the Line Between Bounce and Breakdown
The chart identifies a specific validation threshold above current price. Reclaiming $168.5 - and ideally $170 - is required to confirm that NVDA is returning to its normal trading range. Without that reclaim, the signal remains inconclusive.
The structure visible across multiple prior setups supports this framework:
- Price has repeatedly dipped below the lower band before rebounding
- Each prior move was followed by a swift recovery into the Bollinger range
- The current setup mirrors those earlier conditions closely
NVDA Tests $153 Support as Critical Fibonacci Level Comes Into Focus offers additional context on the broader support structure NVDA has been navigating.
Gap Down Scenario Adds Complexity to NVDA Mean-Reversion Setup
A lower open could briefly extend the move before a reversal attempt unfolds - a gap acting as a magnet before the bounce.
One element complicating the setup is the possibility of a gap down at the open. In this scenario, price briefly extends lower into a liquidity zone before stabilizing and reversing. This type of behavior has appeared in prior NVDA corrective phases, where pullbacks tested lower levels before attracting buyers.
Nvidia Holds Below 200SMA as $165-$171 and $148-$152 Demand Zones Emerge maps out the demand clusters relevant to exactly this kind of scenario.
The setup remains reactive - and the next session is likely to determine whether this breakdown is simply another short-lived deviation below the band.
At this stage, NVDA is not in trend continuation mode. The stock is defined by how quickly it can reclaim lost ground. If $168.5 is recovered with conviction, the Bollinger Band breach becomes another short-lived deviation. If it stalls, the move risks evolving into something more sustained. Nvidia Approaches $197 Golden Ratio Level Before Earnings Report provides broader perspective on where NVDA was trading before the current corrective phase began.
 Usman Salis


