Peter Smith
NVIDIA has pushed higher following a multi-month compression phase, with the latest move reinforcing bullish structure. As MentoviaX noted, the stock broke out of a 9-month ascending triangle and surged roughly 21% in three weeks - setting up a potential move toward the $206-$212 range.
The NVDA Pattern That Finally Resolved Higher
The chart clearly shows a long period of consolidation capped by horizontal resistance near the $197 level. Repeated rejections in that zone defined the upper boundary of the ascending triangle, while rising lows formed a supportive trendline beneath price. That structure has now broken to the upside.
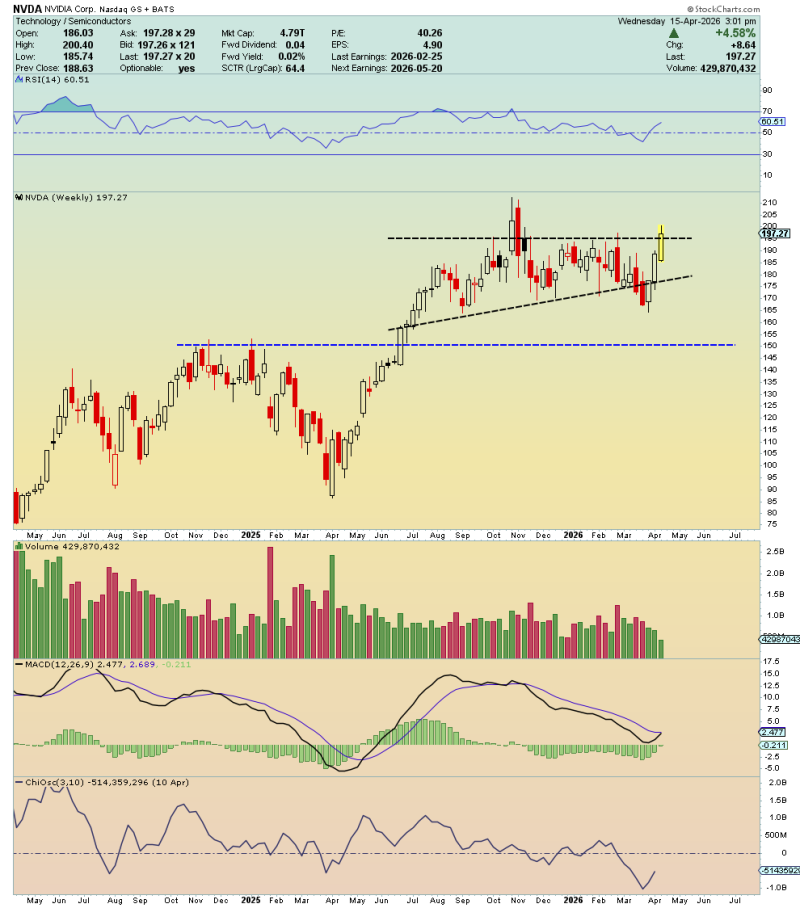
The breakout above ~$197 aligns with what technical analysis typically describes as a volatility expansion phase following prolonged compression. What stands out is the speed of the follow-through - rather than hesitating after the breakout, NVDA accelerated quickly, confirming strong demand above former resistance.
NVDA Stock Analysis: Nvidia Signals Major Move as Bands Tighten documented the tightening structure in the $175-$197 band as it was developing - providing the technical context that makes the subsequent 21% breakout a fulfillment of that compression rather than a surprise.
Why the NVDA $197 Zone Still Matters
Despite the breakout, the same $197 level remains central to the current structure. The chart shows price now hovering just above this area, effectively testing whether former resistance can hold as support.
Holding above this zone would confirm a successful breakout and reinforce the bullish trend. Losing it would signal a failed move and potentially pull price back into the prior range. NVDA Hits $215B in Revenue as Shares Test $197 Resistance showed how the $197 level was already acting as a defining barrier even when approached from below - reinforcing why the current retest from above carries such structural weight.
NVDA Structure Tightens as Momentum Pauses Before Earnings
After the initial surge, NVDA has begun to consolidate just above the breakout zone. The candles reflect a narrowing range - suggesting that momentum is cooling but not reversing. Key structural elements remain intact:
- Higher lows continue to form above the rising trendline
- Price is holding above the former resistance area
- No decisive rejection from current levels is visible
This type of consolidation often acts as continuation rather than exhaustion, particularly when it occurs above a breakout level. NVDA Stock Targets $200 After Technical Rebound outlined the path toward $200 as the initial target following the rebound setup - a level that has now been cleared and is being held as the consolidation base for the next leg toward $206-$212.
With earnings approaching, the technical setup is clearly defined. The $206-$212 range represents the logical continuation zone following the breakout move - and for now, NVDA is holding above a key level after a strong advance, exactly the type of behavior that suggests a breakout is maturing into a sustained trend rather than reversing.
 Peter Smith