Peter Smith
Netflix stock is attempting to regain momentum after a sharp pullback, with the chart suggesting the correction may have established a base for the next leg higher. The structure highlights a developing wave pattern, where the recent rebound could mark the early stages of a larger continuation move.
The NFLX Pullback That Marked a Turning Point
The chart shows a strong advance into a peak labeled as Wave 3, followed by a sharp decline into the $75 region. This area aligns with the 0.5 Fibonacci retracement level, where price found support and began to stabilize.
As The Long Investor noted, this pullback coincided with the point where Bill Ackman exited his position - missing the subsequent recovery. The chart explicitly highlights this zone, reinforcing it as a key inflection point in the broader structure.
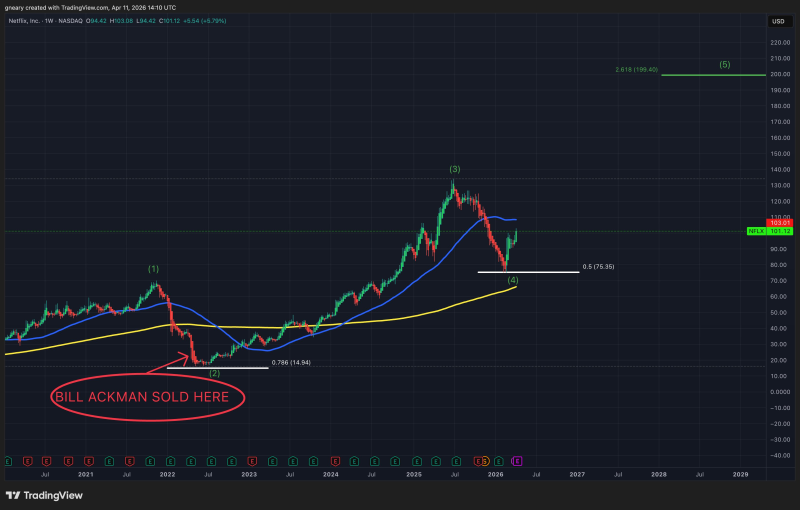
The rebound from this level has been notable, with price pushing back above the $100 area - suggesting that buyers are reasserting control after the correction phase.
A NFLX Structure That Still Favors Continuation
The broader technical picture reflects a corrective phase rather than a full trend reversal. Price is stabilizing above long-term support while attempting to rebuild momentum. NFLX stock reclaiming key moving averages shows how similar technical shifts in NFLX have marked improving momentum in prior recovery phases - with the $107 resistance now the immediate hurdle the current rebound needs to clear.
NFLX breaks above the 200-day moving average reinforces how decisively the character of NFLX price action can shift once key long-term averages are reclaimed - making the current recovery attempt more meaningful than a routine oversold bounce.
The NFLX Projection That Defines the Next Phase
The chart outlines a potential Wave 5 extension targeting the $200 region, aligning with a 2.618 Fibonacci extension level. This type of projection typically represents the final leg in a trending sequence following a completed correction. The framework is clearly structured:
- The $75 area marks the Wave 4 support and remains structurally critical
- The $100-$103 zone reflects the current recovery range
- The $200 level is the projected Wave 5 target based on the chart structure
NFLX approached key buy zones near moving averages shows what the intermediate targets look like on the path toward $200, reinforcing that the move is expected to develop in stages rather than in a single vertical advance.
 Peter Smith