Marina Lyubimova
⬤ Netflix stock drew notice when a twenty year chart showed the size of its rise. The line starts in 2002 at a split adjusted price near one dollar and ends in the early 2020s above one thousand. The gain equals ninety five thousand percent. Every dip no matter how steep, later reads as a flat stretch.
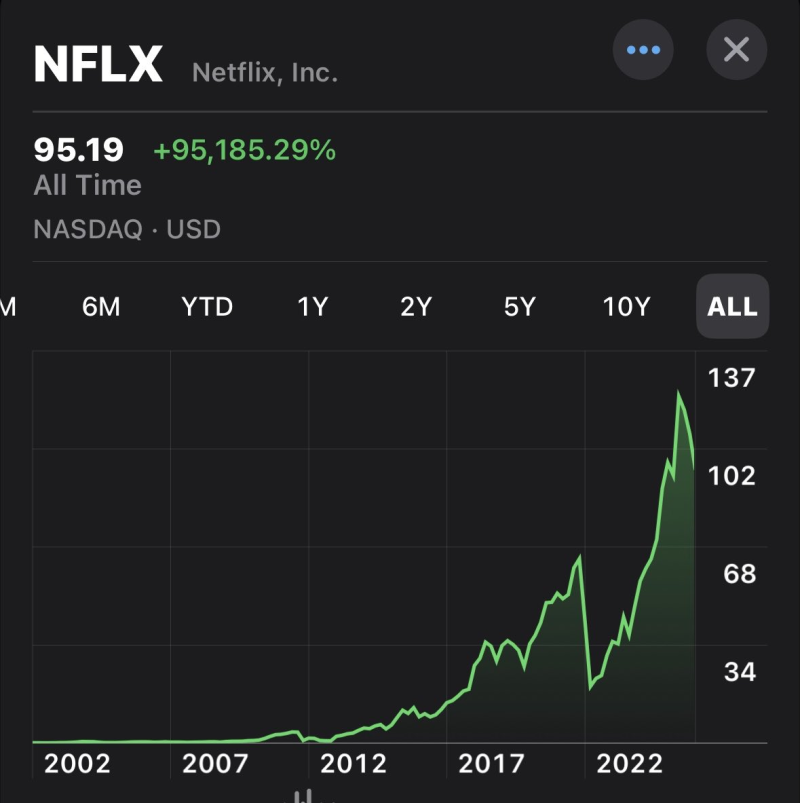
⬤ The chart runs from 2002 to the early 2020s. The first five years show little motion. Once the company opened its streaming service, the price climbs without breaking the upward slope. Even the worst drawdowns fail to push the line below the prior high for long.
⬤ Sharp corrections appear in 2008, 2011, 2015 and 2018. Each time the stock falls more than half - yet the recovery erases the loss and prints a higher peak. Viewed at this distance the drops look like small ruts in the road.
⬤ The point is not when you buy but that you keep holding. Netflix turns a dollar invested at any date since 2002 into a larger dollar today, provided the holder stays through the swings.
 Marina Lyubimova