Eseandre Mordi

⬤ Microsoft is back on traders' radar after a sharp drop from highs above $540. The stock recently tested its 200-week moving average - a level that has acted as major structural support during every significant correction over the past decade. This kind of pullback is rare, and historically it has marked an important reset point for the stock's longer-term trend.
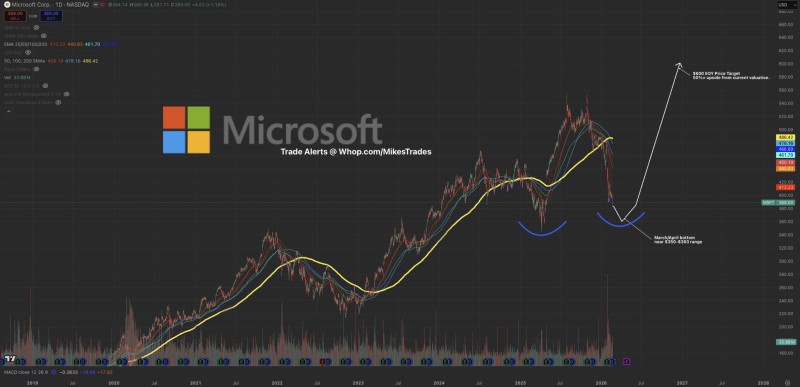
⬤ The slide has pushed MSFT toward the $380-$390 zone, with technicals pointing to a potential bottom forming around $350-$360 during March-April. This is only the third time in 13 years the stock has approached the 200-week moving average - which helps explain why the move is getting so much attention from long-term investors.
Rare corrections toward the 200-week moving average have historically coincided with important turning points in Microsoft's long-term trend.
⬤ If this support zone holds, the chart points to a rounded-bottom recovery before a push toward the $600 area. The $380 level carries extra weight here - it's where the 200-week moving average and key Fibonacci levels converge. With the forward P/E dropping to 22x, some analysts view this as a rare opportunity to enter a high-quality name at a meaningful discount.
⬤ Longer-term context adds conviction to the setup. As shown in 12+ years of 200WMA data, this moving average has never meaningfully broken as support through multiple market cycles. How MSFT behaves around this zone in the coming weeks could set the tone not just for the stock, but for broader sentiment across large-cap tech.
 Eseandre Mordi