 Usman Salis
Microsoft shares have pulled back sharply from their all-time highs, and traders are now closely watching whether a key support zone can hold. After months of steady decline from above $550, MSFT is hovering around $408, right on the edge of what chart analysts consider a critical demand area near $391. The setup has drawn attention across the technical community, with signals pointing to a possible reversal if buyers show up at this level.
Descending Wedge and RSI Divergence Point to Possible Rebound
The chart structure behind this move is worth unpacking. MSFT has been forming a descending wedge pattern, where price prints lower highs and lower lows while gradually compressing. That kind of tightening action often precedes a breakout, particularly when it develops near a historically significant support zone. The $391 area fits that description, corresponding with a gap fill level that has previously acted as a stabilization point before recovery attempts.
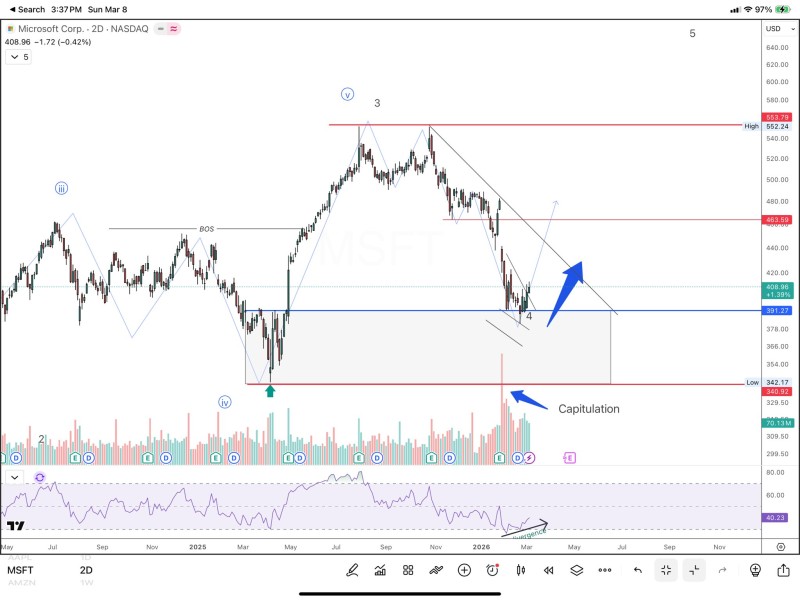
Adding to the bullish case is RSI divergence, where the relative strength index trends upward even as price continues to drift lower. This divergence typically reflects weakening selling pressure and is often an early warning that a trend is losing momentum. Alongside this, elevated trading volume near recent lows points to what technical analysts often describe as a capitulation phase.
MSFT Price Targets: $463 Resistance and $340 Downside Risk
Beyond chart patterns, there are other signs that some traders are positioning for a recovery. Rising call option activity around the $400 level suggests at least some market participants expect a bounce from current levels. Microsoft has also been consolidating in a relatively tight range after the bulk of the correction, which can sometimes serve as a base-building phase.
The levels ahead define the stakes clearly. A successful defense of $391 could put $463 in play as the next resistance target, with the prior high near $553 as the longer-term objective if the recovery gains traction. On the downside, a break below support opens the door to an extension toward $340, a deeper area that also appears on the longer-term chart as a meaningful zone. How Microsoft trades around $391 in the coming sessions will likely determine whether this correction has run its course or still has further to go.
 Usman Salis


