 Usman Salis

⬤ Microsoft Corp just wrapped up another losing month, sitting near the $400 mark after giving back most of its late 2025 gains. With the daily chart showing a clear downward slope. The $400 zone has become a battleground, and the company's market cap has pulled back from its $3 trillion peak as shares struggle to find footing.
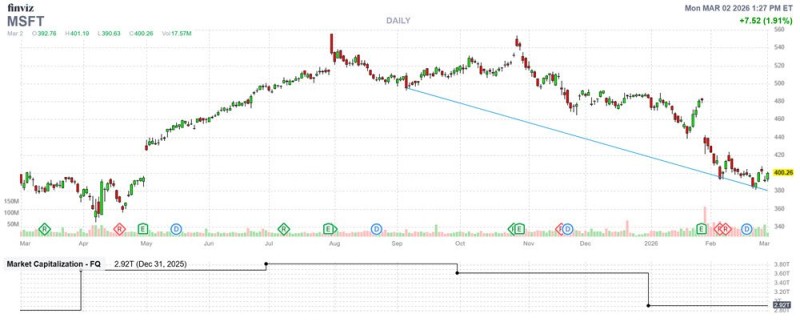
⬤ The technical setup tells a rough story. MSFT pushed above resistance late last year but got rejected hard near the highs, sparking a steep selloff that's carved out lower highs and lower lows on the daily timeframe. The chart pattern from late 2025 into early 2026 shows persistent selling pressure, though there's a silver lining: call option buyers have been more active than put buyers over the past 10 days, hinting that some traders still see upside potential even as the stock bleeds.
⬤ The stock is testing multi-month support levels that could either serve as a launchpad or give way to further declines. A break above recent resistance would flip the script and potentially restart the uptrend, but right now the pressure is real and the path forward unclear.
⬤ What happens with MSFT matters beyond just one stock. As a megacap tech heavyweight in major indexes, Microsoft's price action often sets the tone for broader market sentiment and risk appetite. If shares can hold current support and reverse higher, it could signal renewed confidence in the tech sector. But continued weakness here might reinforce doubts about whether big tech can keep leading the market higher.
 Usman Salis


