 Usman Salis

⬤ META has moved into a technically weaker position after closing the week below its 100-week moving average, a key long-term trend indicator. The move confirms the August high as a major top, with price now entering a broader corrective phase visible on the weekly chart.
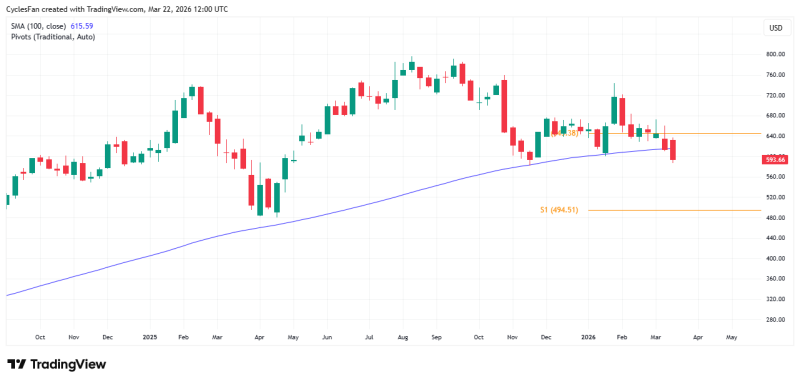
⬤ The chart shows META trading near $597.66, clearly below the 100-week MA at roughly $615.59. This breakdown signals a loss of long-term support, with price structure forming lower highs since the August peak. Losing a major moving average at this scale typically precedes deeper retracements. Similar pressure was building in the earlier META Stock Analysis: Bearish Signals Near $613 as 626M Volume Block Holds the Key, where downside risk was already emerging near comparable levels.
⬤ Attention now turns to the next key support near the November low at $581. If bearish momentum holds, this level may not provide lasting stability. Below it, the first yearly support pivot at $494.51 becomes the major downside target. Earlier setups in META Stock Forecast: Pullback Nearing Key Support already pointed to retracements toward defined support zones as part of broader trend continuation patterns.
⬤ The broader technical picture shows META shifting from a strong uptrend into a corrective phase, with long-term indicators turning neutral to bearish. This mirrors conditions covered in Meta Stock Oversold: META Near Critical Support at PoC, where price approached key inflection zones under pressure. With META now below a major structural level, the question is whether support can stabilize price or if the corrective phase extends toward the $494 pivot.
 Usman Salis


