 Marina Lyubimova

Meta Platforms (META) is trading beneath its 100-week moving average for the first time since the 2022-2023 cycle, marking a rare structural shift that has historically coincided with major turning points. A long-standing support level has quietly given way - and the implications are significant.
As Barchart noted, META has lost its 100-week moving average, a level that previously acted as a foundation for reversals and long-term recoveries.
The 100-Week MA Breakdown That Changed META's Momentum
The weekly chart shows a powerful multi-year uptrend that carried META from sub-$100 levels in 2022 to highs approaching $750-$800.
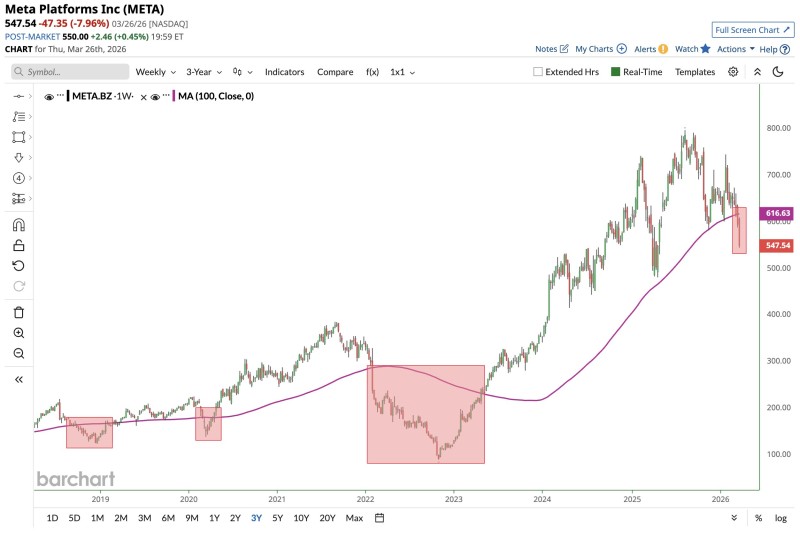
That rally was supported by a steady sequence of higher highs and higher lows, with the 100-week moving average acting as a consistent floor during pullbacks. That structure is now under pressure.
The recent decline pushed META below the 100-week moving average - positioned around the $610-$620 zone - while price currently trades closer to $547. This is not just a marginal dip; it represents a clear loss of long-term support.
The recent decline pushed META below the 100-week moving average - positioned around the $610-$620 zone - while price currently trades closer to $547. This is not a marginal slip. It represents a clear loss of long-term support, similar to prior phases where trend strength weakened before deeper corrective moves followed. Recent technical coverage from META Stock Breaks 100W MA With $581 and $494 Targets Now in Focus also confirms that closing below this level places the stock into a more vulnerable structure, often preceding extended downside.
META's 100-Week MA Flips From Support to Overhead Pressure
What makes this move notable is how price behaved after the break. META attempted to stabilize near the moving average but failed to reclaim it. Instead, the level is now acting as resistance - a classic transition where former support becomes a ceiling.
This shift is reinforced by:
- A series of lower highs following the peak
- Increased volatility near the top of the trend
- A sharp rejection after retesting the moving average
Similar behavior has been observed when META previously lost key trend indicators, where failed reclaim attempts led to extended downside before stabilization.
Similar behavior has played out before. When META previously lost key trend indicators, failed reclaim attempts consistently led to extended downside before any stabilization emerged. Meta Stock Tests 200-Day SMA as Oversold Signals Flash adds broader context, showing how the stock has been navigating a series of weakening technical signals in recent weeks.
Historical Behavior Around META's 100-Week Moving Average
The 100-week moving average has a strong track record as a cycle-defining level. In prior instances:
- Breaks below it aligned with prolonged corrective phases
- Extended moves under the average preceded major bottoms
- Reclaims often marked the start of sustained bullish runs
This aligns with broader patterns seen when META interacts with major moving averages, where the level acts as a dividing line between bullish continuation and structural reset. The current setup mirrors earlier periods where price moved from strong trend conditions into a more neutral or corrective environment.
As META Stock Analysis: Bearish Signals Persist Near $613 details, bearish signals have been building across multiple timeframes, making this moving average loss harder to dismiss as noise.
The $540-$620 Reaction Zone That Defines META's Next Move
META is now trading in a critical reaction zone between roughly $540 and $620. The key dynamic is no longer just support - but behavior around resistance:
- Holding below the 100-week moving average reinforces bearish pressure
- A failed reclaim suggests sellers remain in control
- A decisive move back above the level would begin to restore bullish structure
What stands out is the shift in character. META is no longer trending cleanly higher - it is testing whether the previous trend can be sustained at all.
At the same time, the broader trend is not fully invalidated. The stock remains significantly above its 2022 lows, and long-term momentum, while weakened, has not completely reversed. What stands out is the shift in character. META is no longer trending cleanly higher - it is testing whether the previous trend can be sustained at all.
 Marina Lyubimova


