Saad Ullah

IREN is approaching a pivotal technical moment, with price sitting directly beneath a descending diagonal that has capped upside for months. According to Fibby., this trendline has defined bearish control since November, repeatedly forcing the stock into lower highs.
The IREN Diagonal That Keeps Rejecting Price
The weekly chart shows a clear sequence of lower highs, each formed at the same descending resistance. This green diagonal has acted as a ceiling, where sellers consistently step in and halt upward momentum.
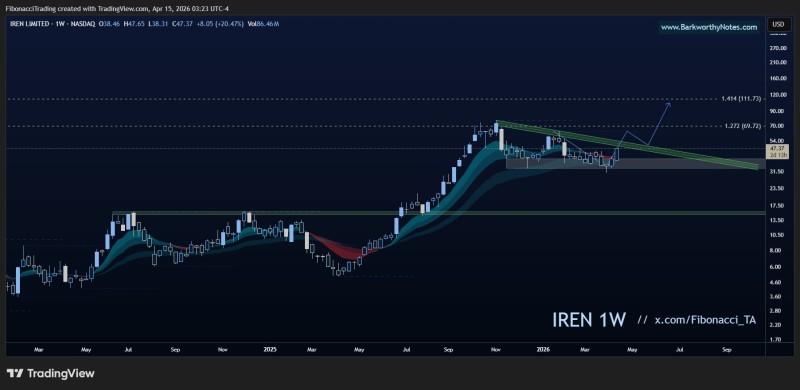
Since late 2025, every attempt to push higher has failed at this level, reinforcing its importance. The structure is not random - it reflects a controlled downtrend within a broader consolidation following a strong prior rally.
This trendline has defined bearish control since November, repeatedly forcing the stock into lower highs.
At the same time, price has been stabilizing above a horizontal base in the low-$30s, creating a tightening range between support and descending resistance. As covered in IREN Stock Rejected at $40 Bull Market Support Band, that support zone has been tested and held on multiple occasions.
A Pattern of IREN Lower Highs Nearing Resolution
What stands out now is how price is interacting with this diagonal. Instead of being sharply rejected, IREN is consolidating just below it, forming a compression pattern.
The repeated tests of resistance are weakening the barrier, while the inability to push significantly lower indicates that sellers are losing some control.
This behavior suggests that the market is approaching a decision point. Similar compression setups have been documented in recent IREN technical coverage at IREN Stock Tests $45 Resistance, where tightening structures often precede larger directional moves.
The IREN Breakout That Could Change Everything
The entire setup hinges on whether price can finally break above this descending trendline. If that breakout occurs, it would invalidate the series of lower highs and mark a structural shift.
In that scenario, the following upside targets come into focus, aligning with projected extensions and prior expansion zones:
- $70 - first major resistance and short-term breakout target
- $111 - extended target aligning with prior expansion highs
If the diagonal continues to hold, however, the pattern remains intact, and the stock stays locked in its current structure.
For context on what a successful breakout could look like structurally, IREN Stock: $100 Breakout as $45 Wedge Pattern Holds outlines a comparable setup and its implications.
For now, IREN stock is sitting at what can only be described as a mission-critical level, with the next move likely to define the trend for weeks ahead.
 Saad Ullah