 Saad Ullah
Hims & Hers Health is flashing clear technical warning signs as a once-promising bullish setup collapses under sustained selling pressure. In a recent breakdown flagged by Thomas James Investing, the retracement on HIMS has now exceeded 50% of the prior move - invalidating the bull flag and locking in a bearish structure that shows no sign of reversing.
HIMS Bull Flag Pattern Loses Its Structure
What looked like a textbook consolidation has turned into a full-blown failure. The price retraced more than half of its prior upward leg - a threshold that typically signals the end of any continuation setup.
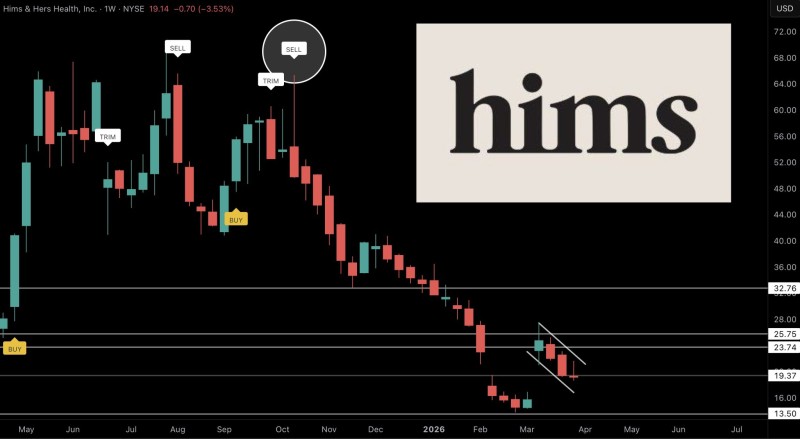
Rather than coiling for another push higher, HIMS has instead built a sequence of lower highs and lower lows. That alone confirms the shift into a downtrend. The earlier sell signal near the $60 level marked the turning point, and price has been grinding lower ever since with no structural recovery in sight.
The retracement now exceeds 50% of the prior move, invalidating the bull flag and reinforcing bearish structure.
This aligns with what recent HIMS stock analysis has consistently shown - sustained selling pressure keeping the structure bearish without any confirmation of a reversal attempt.
HIMS Stock Price Action Shows Continued Weakness Near $19-$23
Recent price action leaves little room for optimism. HIMS has been trading near the $19-$23 zone, with only brief and shallow bounce attempts that fade quickly.
A short-term upward channel did form over recent weeks, but that structure is now breaking down too - meaning even local relief rallies are failing to hold any ground.
The current behavior reflects a market where:
- Rebounds are short-lived and quickly sold into
- No higher highs are forming
- Price remains compressed near recent lows
Even as the stock approaches areas where buyers could emerge, support zones are being tested without strong defense.
Coverage across recent HIMS price prediction pieces reinforces the same read - testing support without confirmation typically keeps downside pressure intact rather than triggering a reversal.
No HIMS Buy Signal Confirmed Despite Prolonged Decline
Despite how far the stock has fallen, the chart still does not show any new buy signal. The last confirmed signal remains the sell generated near $60, and that bias has not changed.
That absence of confirmation matters more than the price level itself. In technical analysis, a trend stays intact until proven otherwise - and right now, price action continues to reflect seller control at every bounce attempt.
Until price structure shifts through stronger rebounds or a break in the sequence of lower highs, HIMS remains firmly in a downtrend.
Institutional accumulation data showing 48.7M shares at the $19 floor is worth watching, but it has not yet translated into a structural shift. Until HIMS prints higher highs or produces a confirmed buy signal, the path of least resistance remains lower.
 Saad Ullah


