 Eseandre Mordi
HIMS stock has reached a critical inflection point after a prolonged selloff, with price pressing into a major institutional support zone while downside momentum remains intact. Analyst Peter DiCarlo notes the stock has been in a bearish phase since October, with a decline of roughly 60% from its highs. The setup may look attractive after such a steep drop, but the chart shows no confirmed shift in control - keeping pressure firmly on the downside.
The Breakdown That Defined HIMS Stock's Trend
The structure on the weekly chart reflects a clear and sustained downtrend. After topping out near the $70 region, HIMS began printing consistent lower highs and lower lows, signaling a loss of bullish control and a transition into a bearish phase.
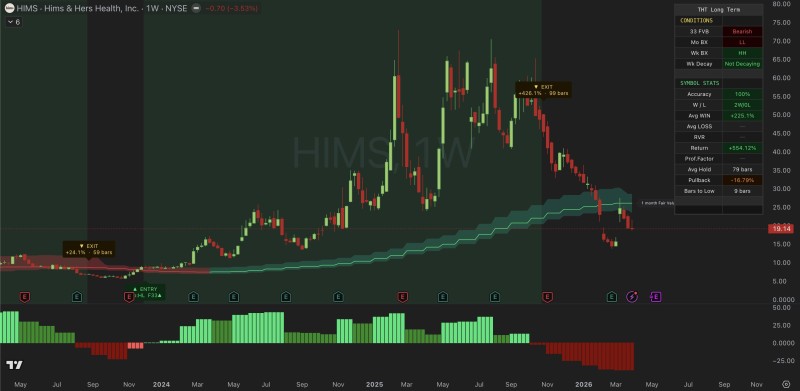
The move accelerated into late 2025 and early 2026, with multiple failed rebound attempts and continued selling pressure. This aligns with broader technical readings seen across HIMS Price Prediction: Wave 2 Nears End, where the stock has remained under persistent pressure and struggled to establish any meaningful base.
HIMS Hits Support Zone - But Without Confirmation
Price is now sitting directly on a long-term support zone, described as a monthly fair value band. This area typically represents institutional interest and is monitored closely by active traders.
However, the chart reveals a critical detail: support is being tested, but not defended. There are no strong bullish candles, no sharp reversals, and no visible expansion in buying pressure. Price action remains weak, with only minor stabilization attempts that fail to shift the broader trend. As outlined in HIMS Stock Tests $15.75 Support After Decline, similar dynamics have played out across recent weeks without resolution.
Support is being tested, not defended. There are no strong bullish candles, no sharp reversals, and no visible expansion in buying pressure.
From a technical standpoint, this is not a confirmed bottom - it is simply price interacting with support.
Where the Buy Signal Still Hasn't Appeared
The key concept here is the distinction between location and signal. While HIMS is positioned at a level where buyers could step in, there is no evidence yet that they actually have. Current chart behavior reflects:
- Continued weak price structure with no higher highs
- Lack of momentum shift despite reaching support
- Ongoing seller dominance in recent candles
This reinforces a core principle: being "cheap" is not the same as being "ready."
The Risk of Anticipating a Bottom in HIMS Stock
The current setup highlights a common trap in technical analysis - assuming that a sharp decline into support automatically signals a reversal. As covered in HIMS Stock Oversold With Support at $15 and $13.60, even deeply oversold conditions can persist without triggering an immediate recovery.
Being at a level that attracts attention is not the same as having confirmation. The trend remains unchanged until price action shows otherwise.
HIMS may be sitting at a zone that draws interest, but without confirmation of buying strength, the trend remains unchanged. The chart continues to reflect a market controlled by sellers, not one transitioning into accumulation. Until price action shows a clear structural shift - stronger rebounds or a change in candle behavior - the downside bias remains the dominant narrative.
 Eseandre Mordi


