 Eseandre Mordi

After a prolonged stretch of choppy and indecisive trading, the latest chart points to a meaningful shift. Both price and AlgoFlow are rising together, suggesting a structured advance is underway rather than another failed attempt at trend formation. According to Fibby., this kind of alignment is exactly what separates noise from a genuine trend signal.
HIMS has transitioned from a loose range in the low $20s into a gradual uptrend, with a sequence of higher highs and higher lows taking shape. The move is not explosive - it is controlled, a steady grind rather than a spike-driven rally. That distinction matters.
When HIMS Flow and Price Finally Matched
The defining change in the current setup is synchronization. AlgoFlow has held above zero all week while pushing steadily toward the 2.5M level.
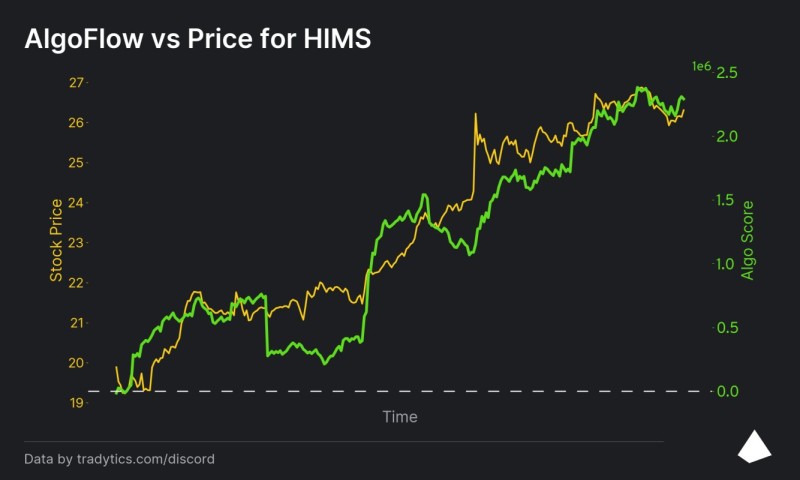
Earlier phases were marked by failed crosses and unstable flow behavior - buying interest appeared, then quickly faded. This time the signal looks different: flow is not only positive, it is persistent.
Flow is not only positive, but persistent - and that combination is what often signals accumulation rather than reactive trading.
That persistence is what separates this setup from previous attempts. Traders following HIMS stock short squeeze speculation fueling a rally on $2.35B revenue and 40% growth will recognize that sustained buying pressure - not a single spike - is what tends to shift a stock's character.
The HIMS Base in the Low $20s That Started the Move
The low $20s zone now stands out as the origin of this shift. That area is where the move began, and more importantly, where flow first turned decisively positive. Instead of acting as a temporary bounce zone, it became the foundation for the current structure. Price stabilized and flow began to build without interruption - a combination that often signals accumulation rather than reactive trading.
This aligns with the emphasis on sustained buying tied to longer-dated positioning. The key takeaway is not just that buyers stepped in, but that they stayed active across multiple sessions. Traders who watched HIMS stock break the $26 gamma wall as dealer hedging drove the move will find this phase familiar - a foundation being laid before the next leg.
A Clean HIMS Trend - With a Clear Risk Line
The current structure remains intact as long as the relationship between price and flow holds. The chart shows no major divergence between the two - which is typically where trends start to weaken. However, the setup comes with a clearly defined invalidation point:
- A drop in AlgoFlow below 1M
- Combined with price returning to the low $20s
That combination would signal that the sustained buying campaign has faded and potentially revert the stock back into the prior choppy regime. Context from HIMS stock facing little resistance until $30 as price stabilizes near $15 helps frame how much runway remains above if buyers hold their ground.
A Shift From Noise to Structure
What stands out most in this chart is not just the direction, but the quality of the move. Previous attempts lacked follow-through, with flow failing to confirm price advances. This time both metrics are moving in tandem.
That alignment places HIMS in a different category compared to its recent behavior - less reactive, more structured, and driven by consistent participation rather than short bursts. In a market where many setups fail to hold momentum, that kind of confirmation is exactly what traders tend to watch for next.
 Eseandre Mordi


