Eseandre Mordi
Alphabet's GOOGL is transitioning out of a powerful uptrend, with technical structure now pointing toward a multi-leg correction. As Elliottwave Forecast highlighted, the super cycle that began in October 2022 may have completed, shifting focus to a developing corrective pattern that carries real implications for the broader stock market trend.
The Elliott Wave Peak That Shifted GOOGL's Structure
The chart confirms a completed five-wave impulsive structure, culminating near the mid-$350 area. This aligns with classic Elliott Wave theory, where a full cycle typically precedes a corrective phase.
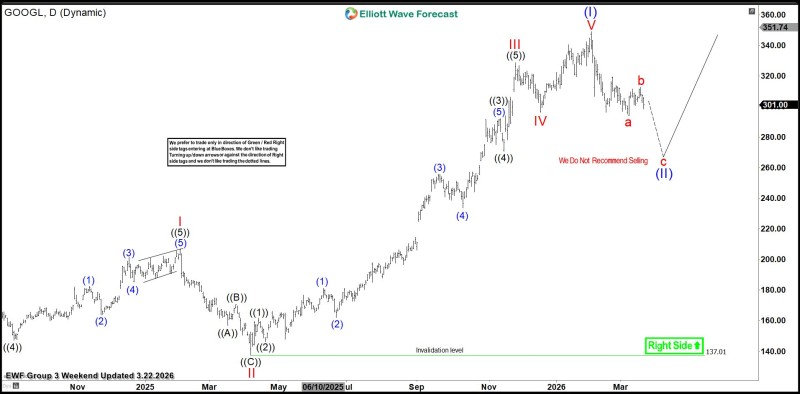
Following the peak, price began rolling over and forming the early stages of lower highs. The transition is not abrupt but structurally clear: the prior pattern of higher highs has stalled, replaced by hesitation and fragmentation in price action.
This change reflects a loss of upside momentum rather than aggressive selling - an early but important distinction in technical analysis.
Earlier bullish setups told a different story. GOOGL surged 40% from a support zone as Elliott Wave pointed to a $340 target - a move that now looks like the final leg of that impulsive cycle.
A 3-Wave ABC Elliott Wave Correction Now Unfolding in GOOGL
The current structure suggests an ABC correction is underway. Wave "a" has likely begun, with a potential recovery into wave "b" before a deeper move into wave "c." This type of pattern typically unfolds in stages rather than a straight decline.
The presence of a lower high near the $300-$310 region reinforces the idea that buyers are no longer able to regain control. Projected downside paths in Elliott Wave models often revisit prior demand zones.
Similar setups have previously seen GOOGL retrace into key support areas before stabilizing.
It's worth noting that the chart highlights a "Right Side" bullish bias only above a distant invalidation level near $137, meaning the long-term structure remains intact - but the short-term trend has flipped. This distinction matters: markets can stay bullish on a higher timeframe while still undergoing meaningful corrections in the interim. GOOGL stock hitting the $306 support zone is exactly the kind of area where Elliott Wave models flag potential reversals.
Elliott Wave GOOGL Outlook: Transition, Not Collapse
What stands out is the nature of this decline. GOOGL is not experiencing a sharp breakdown but rather a controlled pullback - often characteristic of corrective cycles rather than full trend reversals.
For now, the key signal is structural: the market is no longer trending upward. It is transitioning - shifting from impulse to correction. How this ABC pattern develops will likely determine whether GOOGL stabilizes for another leg higher or extends its pullback further.
Historically, Elliott Wave corrections following strong rallies tend to retrace portions of the prior move before resuming direction or forming a broader range. That's consistent with what GOOG Alphabet showed after extending its rally 40% higher following Elliott Wave support - corrections matured, support zones held, and the upside resumed.
 Eseandre Mordi