 Usman Salis

⬤ Alphabet Inc. (GOOGL) just dropped into what traders call a "blue box" support zone, and it's sitting right around $306. Elliott Wave analysts flagged this area between $299 and $286 as a spot where buyers historically step in. The stock's been correcting lower in what looks like a textbook Elliott Wave pattern, and now it's reached the exact zone where the technical setup suggests the selling might be running out of steam.
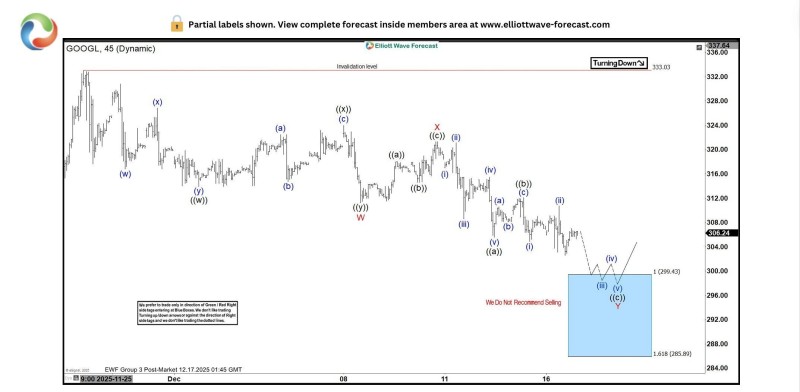
⬤ The chart shows the decline unfolding in predictable segments, with multiple wave counts mapping out how the stock got here. What makes this interesting is the risk-reward picture—it's starting to tilt heavily toward the upside once price enters this blue box territory. There's an invalidation level marked around $333, meaning as long as GOOGL stays below that, the correction is still technically alive.
⬤ Here's why this matters: Alphabet isn't just another tech stock—it's one of the market's heavyweights, and when it makes a meaningful turn, the rest of the sector usually pays attention. If GOOGL bounces cleanly from this support area, it would confirm the bullish structure is intact and could pull other large-cap growth names along with it. But if it breaks down instead, that would signal more caution ahead for big tech and possibly wider volatility across the board.
 Usman Salis


