 Marina Lyubimova

⬤ AST SpaceMobile stock is showing remarkably calm behavior on the weekly chart, a stark difference from its wild price swings in the past. The chart reveals ASTS moving higher in an orderly fashion, staying above rising support levels and progressing steadily upward.
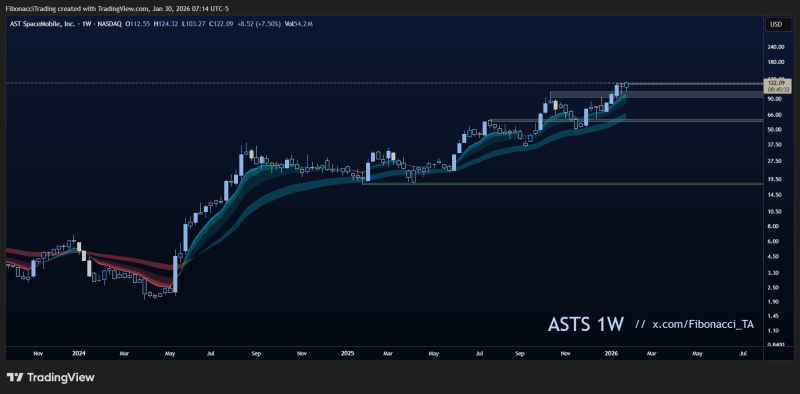
⬤ The weekly timeframe shows a clear shift from earlier chaos into organized trend structure. After building a solid base, ASTS started climbing with consistent higher highs and lows, while pullbacks stayed within well-defined support zones. Price has respected the underlying structure throughout, avoiding dramatic breakdowns and instead pausing before pushing to new levels.
The contrast between the stock's historical swings and the current chart structure is striking.
⬤ ASTS currently trades near $120, sitting at the upper end of its weekly range. Former resistance zones marked on the chart have been reached and held, reinforcing the steady trend rather than erratic jumps. The smooth curve of the support bands emphasizes how controlled this advance has been compared to earlier periods.
⬤ This price action shows how even volatile stocks can maintain clear structure on longer timeframes. The ASTS weekly chart proves that perspective matters—what looks choppy on daily charts can appear remarkably stable when zoomed out. As long as price respects this framework, the chart offers a clean visual guide for how volatility and trend can work together in the same market cycle.
 Marina Lyubimova


