 Marina Lyubimova

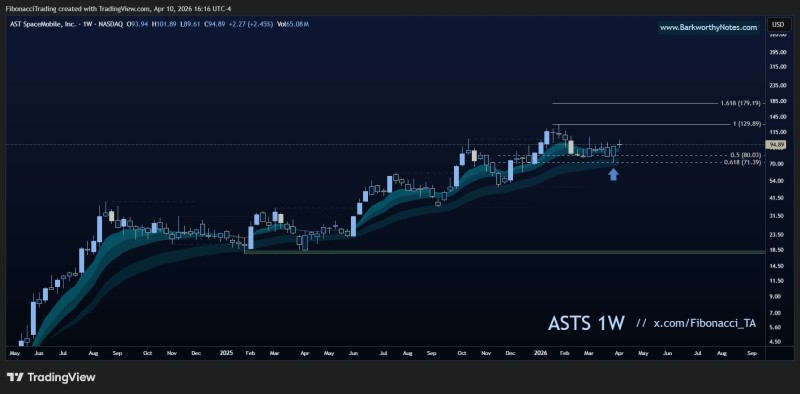
AST SpaceMobile has been holding firm above a critical technical level after a decisive rebound that changed the short-term trajectory of the stock. According to Fibby., the stock respected the 0.618 Fibonacci retracement near $71 and has since advanced more than 40% from that zone - without looking back.
The ASTS Reaction That Defined the Trend
The chart clearly shows ASTS bouncing from the 0.618 level around $71. This reaction marked a turning point, with price climbing sharply from that base in a move consistent with classic Fibonacci support behavior. There has been no indication of a breakdown below that level since the bounce, reinforcing its role as a strong structural floor.
This also aligns with ASTS holding the $70-$80 Fibonacci support zone, a region that technical analysts have repeatedly flagged as a key reference point for the stock's broader trend.
The stock respected the 0.618 Fibonacci retracement near $71 and has since moved significantly higher, without looking back
ASTS Price Consolidating Just Below $95
ASTS ended the week just under the $95 level, with candles forming in a relatively tight range after the sharp upward move. The structure does not show a reversal - it reflects a pause following strong upside expansion, which is a common pattern in stocks that have made extended moves in a short period.
This kind of behavior has been observed in recent sessions, with ASTS trading within a defined $75-$95 range while maintaining its broader uptrend intact.
Price action reflects consolidation rather than reversal - with candles forming in a tight range after the sharp move higher
ASTS Eyes $129 Fibonacci Extension Target
The chart includes Fibonacci extension levels, with a marked target near $129. This figure corresponds directly to projections derived from the current structure, suggesting further upside remains possible as long as the stock holds above its key support base.
The $129 level is not an isolated call. AST SpaceMobile's $129 Fibonacci target has been appearing consistently across broader technical coverage of the stock, giving the zone additional weight as a meaningful reference point.
Extension levels near $129 continue to appear in broader ASTS technical coverage, pointing to further upside if structure holds
ASTS Structure Remains Intact for Now
The current technical setup reflects a stock in a healthy post-breakout consolidation phase:
- Strong reaction from 0.618 Fibonacci support near $71
- Price holding just below $95 with no structural breakdown
- Extension target near $129 still referenced across multiple analyses
Volatility is expected at these levels, but there is no breakdown visible on the chart. The trend remains intact as long as ASTS holds above the key Fibonacci support zone that triggered the original move.
 Marina Lyubimova


