 Saad Ullah

AST SpaceMobile's stock is experiencing a notable pullback that could soon test a critical technical support zone. Trading around $78.36 after reaching multi-month highs above $120 earlier in 2026, ASTS is approaching the lower boundary of its well-established upward price channel. This movement has caught the attention of technical analysts who are watching to see whether the stock will bounce from support or signal deeper corrective pressure. The upcoming test of the $70-$75 range represents a key moment that could define the stock's trajectory in the coming weeks.
ASTS Approaches Channel Bottom at $70-$75 Range
AST SpaceMobile's share price is pulling back toward the previously identified $70 to $75 support range, drawing closer to the lower boundary of its upward price channel. ASTS appears poised to test the bottom portion of this broader channel, which has provided reliable support in past pullbacks.
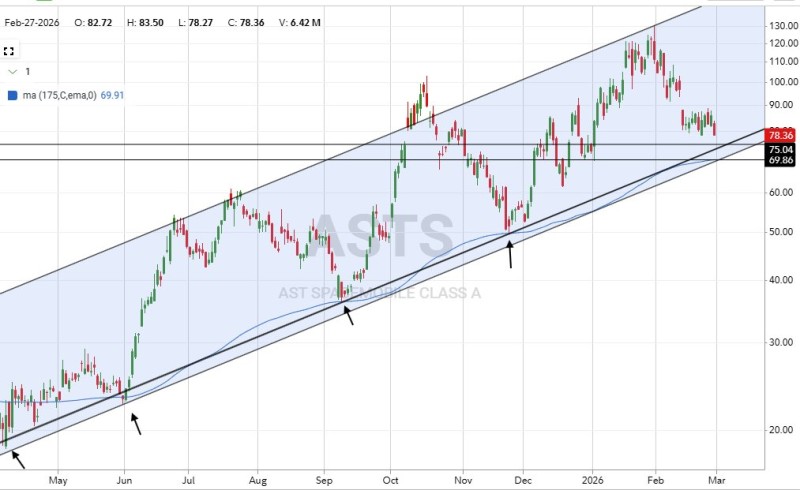
The chart shows a clearly defined ascending channel that has guided ASTS price action through multiple drawdowns and rallies over several months. AST SpaceMobile Holds $84 Support at Key EMA Cloud Level demonstrates how technical levels have played a crucial role in the stock's behavior. Historical lows marked on the channel floor in mid-2025 and late 2025 show how the trendline has acted as dynamic support during corrective periods.
Technical Confluence Creates Key Support Zone
The stock's current downswing toward the $70-$75 range aligns with this channel structure, indicating that ASTS could find buyers upon touching the lower boundary again. In addition to the channel bottom, horizontal support near the $70 level reinforces the incoming technical zone. ASTS Stock Holds $83.90 Inside Rising Channel as SpaceMobile Momentum Builds shows the stock has maintained its position within the broader uptrend structure despite near-term weakness.
Past coverage shows ASTS has been resilient around key support levels, with AST SpaceMobile Drops to $80s After Losing $90 Support highlighting previous pullbacks that eventually stabilized. Traders often view tests of key trendline support as opportunities to reassess positioning when broader patterns remain structurally sound.
The approach toward the $70-$75 range carries broader significance because it represents a confluence of horizontal and trendline support that has historically marked corrective lows rather than trend reversals. How AST SpaceMobile's stock behaves around this zone will likely shape the near-term technical narrative, either preserving the multi-month uptrend or signaling deeper corrective pressure if the channel breaks.
 Saad Ullah


