 Usman Salis

AMD traders kicked off the week looking for cracks after the recent pullback from highs near $265. But instead of crumbling, the stock held firm—a reassuring sign in a market filled with uncertainty. The latest charts show buyers are actively defending the uptrend, with several technical factors supporting stability around the $247–$244 range.
Chart Analysis: Strong Support Keeps Bulls in Control
As John @ The Rock Trading Co. pointed out, "AMD has not made new lows on the day," capturing the cautious optimism currently driving sentiment among both retail and institutional traders.
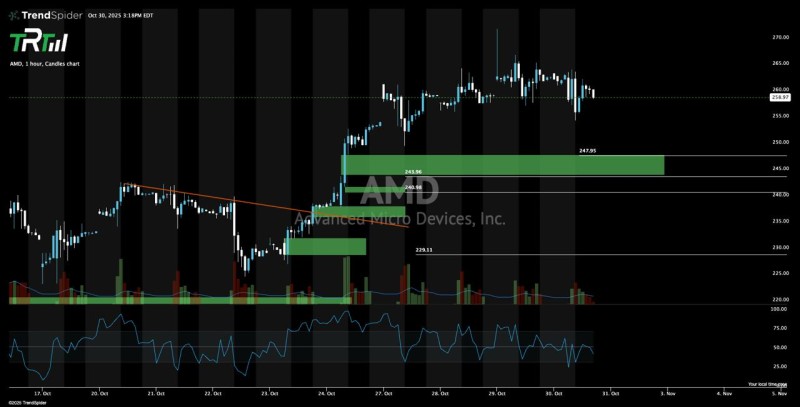
A closer look at the TrendSpider hourly chart reveals a technically solid setup:
- Breakout & Retest: AMD broke through a descending resistance line around October 23–24 and has successfully retested it, flipping it into support.
- Key Demand Zone ($247–$244): This green-boxed area marks a major support cluster where buyers previously overpowered sellers, establishing the current bullish bias.
- Secondary Supports: Below that, historical consolidation levels sit at $240.9 and $229.1, providing extra downside cushion if volatility picks up.
- Price Action: AMD currently trades around $259, forming higher lows while consolidating below its recent $265 peak—a healthy sign of controlled momentum rather than exhaustion.
- Volume & RSI: Volume spiked during the breakout, confirming institutional interest, and has since normalized. The RSI sits in neutral territory, leaving plenty of room for another upward push.
Bottom line: buyers remain in control as long as AMD stays above $247.
Context: AI Momentum Backs the Technicals
AMD's strength isn't just about chart patterns. Growing confidence in the company's AI and data center strategy—especially the upcoming MI300 accelerators and AI-driven GPU traction—is reinforcing investor interest. While the semiconductor sector has cooled after a strong 2024, AMD's ability to hold higher lows suggests traders are positioning for another leg up rather than heading for the exits.
If AMD keeps its footing above $247–$244, a retest of $265 looks likely in the near term. A clean break above that could push the stock toward $270–$275, matching the momentum seen earlier this month. On the flip side, a drop below $243 might temporarily shift focus to $229, though that would likely attract bargain hunters given the strong long-term uptrend. For now, the setup favors a bullish continuation—gradual, steady, and backed by solid volume.
 Usman Salis


