S&P 500's Bullish Technical Figure
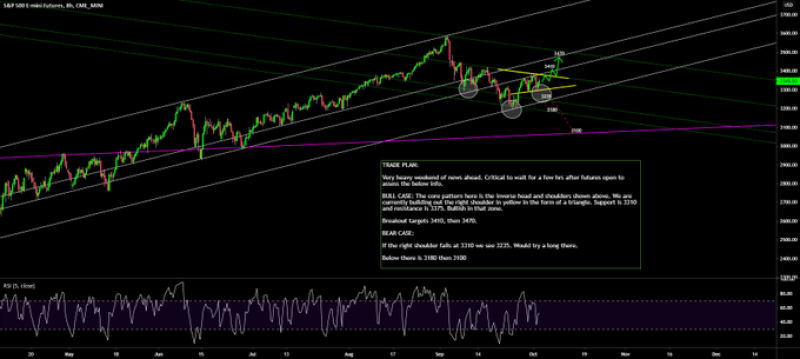
Adam Mancini, an analyst and a trader, presents his technical analysis of the S&P 500, which includes the 500 largest companies by capitalization in the US market. He believes the market will see a significant a bull rally in October.
“Bulls have the setup in $SPX for a significant October rally in the form of an inverse head & shoulders pattern building since Sept 8th and this is make-or-break for the bull case Right now the "right shoulder" is coiling above 3310 & the longer it builds the bigger the run.” Adam Mancini via Twitter

He notes that a technical pattern called "head and shoulders" is now completing its formation in the market, which began in the first half of September. According to Mr. Mancini, the longer it takes to build the second shoulder of the pattern, the stronger the upward rise of the index will be.
Besides, the analyst has already been speculating about the fate of the S&P 500 last week.
"Have a good weekend! Major news weekend for $SPX- where dust settles after open is key My plan: Main setup is a large bullish inverse H&S. If we hold above (or recover) 3310 will be looking long for a breakout to 3470 For bears: If 3310 fails we see 3235- last lvl before 3110" Adam Mancini via Twitter
S&P 500's Future Growth
Earlier, Ryan Detrick, an analyst, a chief market strategist and a senior Vice President of LPL Finance, reported that, according to historical data, the fourth quarter of 2020, which began in October, will be extremely positive for the S&P 500.
In 11 cases out of 11, if traditionally a weak third quarter suddenly turned into growth, this growth will be continued in the fourth quarter. This year, Q3 was unexpectedly strong for the SPX, which was able to gain about 8.5%, despite the correction that took place in October. This is the best indicator in the last 10 years.

If this trend continues this year, then the market will grow, because the average growth of the S&P 500 index is about 7.5%.
 Eseandre Mordi

 Eseandre Mordi


