 Usman Salis

⬤ EUR/USD pushed lower on the hourly chart, pulling back from earlier highs and trading within a descending channel. The pair has now reached the 0.236–0.382 Fibonacci retracement support zone, consolidating around 1.1740–1.1730. Recovery attempts keep getting rejected, and selling pressure dominates the short-term picture, keeping the overall mood cautious and slightly bearish.
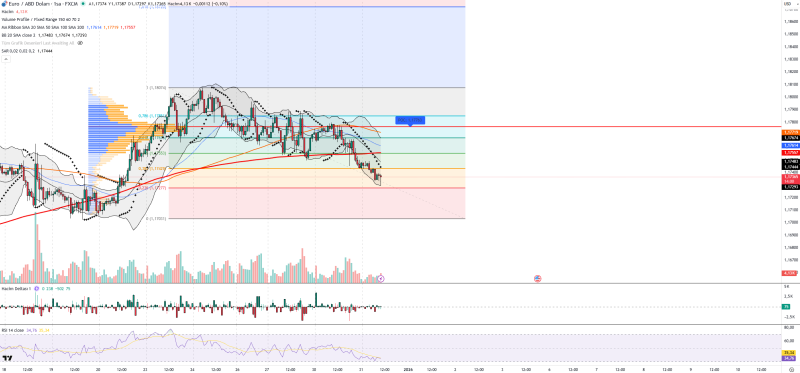
⬤ Technical indicators paint a similarly weak picture. The RSI hovers near 35—not quite oversold but getting close—showing momentum remains fragile. Volume has ticked up during the declines, meaning sellers aren't backing off just yet. The Volume Profile Point of Control sits at 1.1763, acting as a strong resistance and balance zone, while Volume Delta stays negative, confirming that buyers remain hesitant. The pair is also hugging the lower Bollinger Band, which could spark a short-term bounce, though the Parabolic SAR above price suggests the downtrend isn't done yet.
⬤ Key levels are clearly mapped out. Support lies at 1.1744, 1.1736, and 1.1729—areas where buyers might try to step in if the slide continues. On the flip side, resistance zones are stacked at 1.1757, 1.1767, and 1.1779. The 1.1760–1.1770 range looks especially important given the density of past trading activity and trend structure overhead. Unless EUR/USD can push back above those levels, the near-term outlook stays soft.
⬤ Broader market forces aren't helping the euro either. Expectations that U.S. interest rates will stay higher for longer keep the dollar supported, while the European Central Bank hasn't signaled any aggressive tightening moves to lift the euro. Upcoming U.S. economic data and Fed commentary will likely dictate the next big move. How EUR/USD behaves around current Fibonacci support could determine whether we see stabilization or further consolidation ahead.
 Usman Salis


