 Usman Salis

⬤ Alphabet Inc. (GOOG) punched through a descending resistance line that had been capping the stock's recent moves, with the latest hourly candle showing a strong push up toward $317. The breakout carried shares briefly to $317.50, bringing the stock right up against a resistance band highlighted in the $317.90 to $319.98 range.
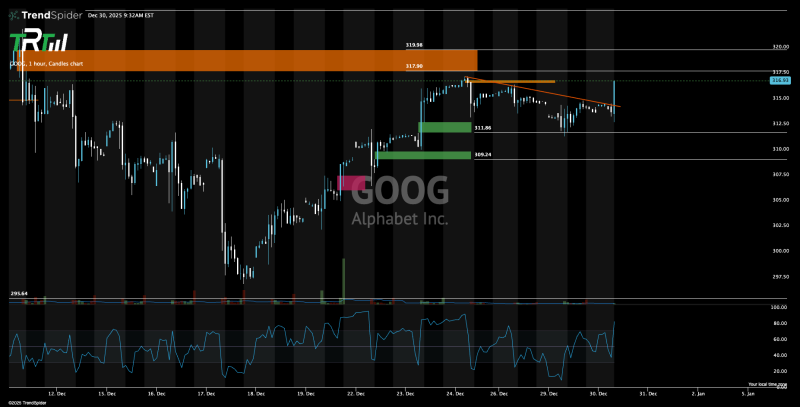
⬤ Leading up to the breakout, GOOG had been carving out lower highs beneath the downward sloping trendline. The break came with a tall green candle that signaled a shift in momentum. Support zones around $311.86 and $309.24 had previously provided a floor where the stock stabilized before bouncing back toward its recent trading range ceiling.
⬤ The $318 to $320 area now stands as the key ceiling to watch. The hourly RSI is elevated, reflecting the strength behind GOOG's recent climb. Breaking above a descending trendline typically signals a change in short-term trading character, and with Alphabet now testing this resistance zone, traders will be watching closely to see if the stock can push through or if sellers step back in to cap the move.
 Usman Salis


