Peter Smith

US trade-price data is turning hotter again, and the latest print matters because it points to inflation pressure that may still be building rather than fading. As The Kobeissi Letter noted, import prices rose 0.8% month over month in March and 2.1% year over year, while export prices climbed 5.6% annually. Set against the long-run chart, that move looks less like noise and more like a fresh upward turn in traded-goods inflation.
The US Trade Price Turn Higher Is Clear on the Chart
The chart shows both import and export prices moving back above the zero line after earlier weakness, with the latest readings boxed on the far right. Import prices are running at about 2.12% year over year while export prices are near 5.57% - a visibly stronger pace.
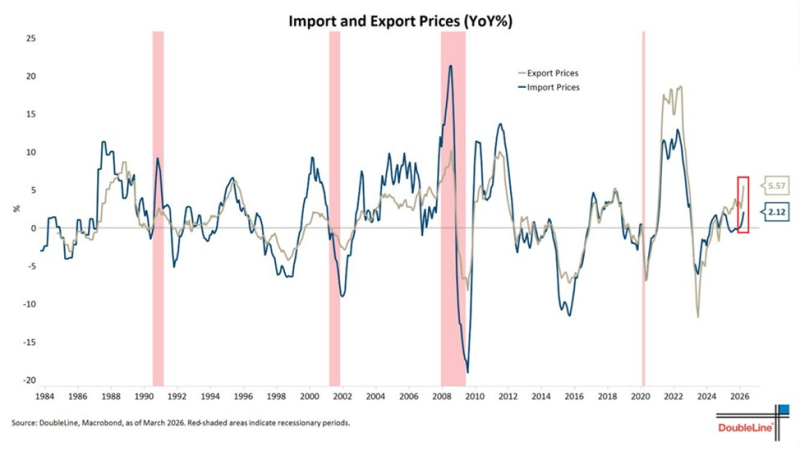
That matters because the current move is not isolated to one side of trade. Both series are rising together, which usually signals broader cost pressure across cross-border goods rather than a one-off distortion. The longer history also gives the move more weight: similar upturns after soft patches have often marked the beginning of renewed inflation pressure rather than the end of it.
Oil Has Started to Bite US Import Prices, but Not Fully
The tweet's most important point is that the oil shock may still be working its way through the system. Imported fuel prices rose 2.9% month over month, and the average crude oil price arriving in the US increased 7.8% over the same period. However, natural gas prices dropped sharply, offsetting part of the broader energy effect.
That helps explain why the headline import figure, while hot, may not yet reflect the full pass-through from oil. If crude-related pressure continues feeding into transportation, industrial inputs, and traded goods, import prices could remain firm in coming releases.
Imported fuel up 2.9% month over month while natural gas dropped - the offsetting effect means the headline number understates the crude pass-through, and if that offset fades, the next print could be materially hotter.
WTI Oil: A $20 Price Shock Could Push U.S. Inflation Up 0.65% quantifies the transmission mechanism that is now showing up in the import price data - with the 7.8% monthly increase in arriving crude prices representing the input that will continue feeding through to broader import costs over coming months.
Export Prices Add a Second Layer of US Trade Inflation Pressure
Export prices rising 5.6% year over year adds another layer to the inflation story. The chart makes clear that export inflation is running hotter than import inflation right now, and that creates a more synchronized trade-price backdrop than markets saw during softer periods.
When export prices are also accelerating alongside imports, the message is broader: price pressure is rebuilding across traded goods rather than being isolated to one side of the ledger.
Oil-Powered Growth Risk: $10/Barrel Rise Could Cut GDP 0.1% and Push Inflation to 2.7% shows the macro framework for how oil-driven trade price increases compound into broader inflation and growth trade-offs - reinforcing why the incomplete pass-through highlighted in the March data makes future readings more consequential than the current headline suggests.
Fed Rates, Oil Shocks, and FX Volatility: What Retail Traders Should Watch places the trade price data within the broader interaction between energy costs, monetary policy, and currency moves - showing how the channels through which oil feeds into import prices are the same ones that complicate the Fed's path toward any eventual easing.
 Peter Smith