Saad Ullah

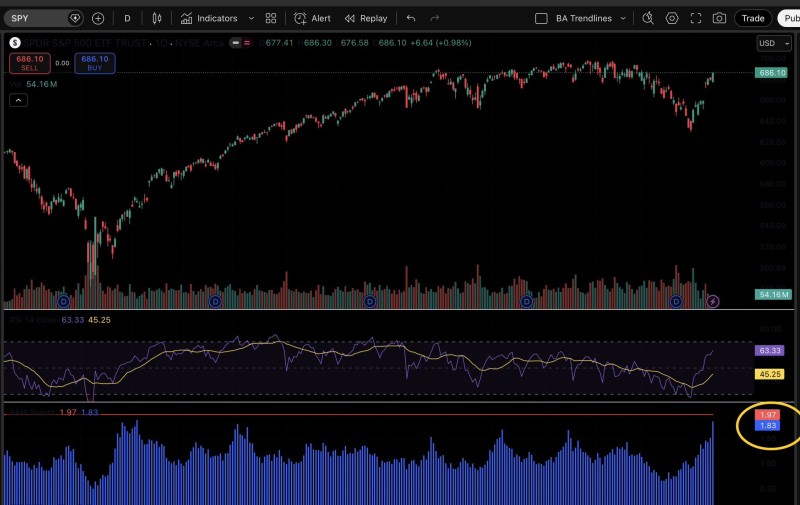
The S&P 500 is closing in on a rare internal market signal as breadth conditions rapidly strengthen. With SPY trading near $686, key cumulative advance-decline ratios are moving toward critical trigger levels - and this setup points to something more significant than a standard rebound. What analysts are watching now is a potential "initiation" phase, one that could define the next structural chapter for the index.
SPY Price Recovery Aligns With Breadth Setup
The SPY chart tells a clear story. Price bounced sharply from the $630 level - identified as a key bottom anchored to a major moving average - and has since reclaimed a large portion of the prior decline, pushing back toward the upper range. The recovery is both swift and meaningful in scale.
According to market analyst Banana3, this move didn't emerge from nowhere. Extreme negative sentiment, volatility spikes, and sharp drops in major stocks all set the stage before the current rebound took hold. The move higher is not an isolated price event - it reflects genuine improvement in internal market participation across a broad range of names.
The 1.97 Threshold That Defines the SPY Breadth Signal
The signal drawing the most attention right now is the Breakaway Momentum Breadth Thrust, known as BAM - a concept originally developed by Walter Deemer. The criteria are precise and demanding. The cumulative advance-decline ratio must exceed 1.97 within 10 trading days. A secondary 20-day version of the same signal requires a move above 1.72.
Breadth thrusts of this kind require extreme conditions in market internals - they don't appear after ordinary corrections.
Current readings place the market right at the edge of confirmation. The 10-day ratio is hovering near 1.97, while the 20-day measure sits around 1.83 - both deep into signal territory. As detailed in SPY Nears Rare Whaley Breadth Thrust Signal With 90-100% Historical Accuracy, similar breadth expansions have historically preceded sustained upside phases, not just brief recoveries.
SPY Initiation vs. Reflex Rally: Why the Distinction Matters
What separates this setup from the typical bounce is the concept of initiation. Most rallies that form during broader declines fade once the initial relief wears off. A breadth thrust signal works differently - it indicates sustained participation and directional strength spreading across the market, not just concentrated buying in a handful of large caps.
This distinction carries real weight for anyone trying to gauge whether the current move has legs. Breadth participation tends to shift before price confirms a new trend, and the current data suggests that shift may already be underway. Even in weaker phases, as covered in SPY Breadth Weakens as 43% Threshold Breaks on 200DMA Participation, changes in internal participation often arrive ahead of larger structural moves.
A Rare SPY Breadth Signal Approaching Final Confirmation
Breadth thrusts of this kind are uncommon by design. They require extreme internal conditions to develop, and when they do, they tend to carry forward-looking weight. The current setup has been building for nine trading days, placing the market at a decision point: reach 1.97 on the 10-day ratio, or allow the 20-day version to capture the same underlying momentum over a wider window.
Supporting indicators are also lining up. The McClellan Oscillator, which has historically aligned with key turning points, is showing patterns consistent with prior inflection moments, similar to those explored in SPY S&P 500 Analysis Shows Dip Buying Signals at -25 McClellan Level.
If confirmed, this signal would not represent a temporary rebound - it would mark a potential structural shift in the direction of the broader trend.
The convergence of price recovery and strengthening breadth puts SPY in a defining position. Confirmation of this signal could mark the beginning of the next trend phase - not a relief move, but a genuine structural shift in market direction.
 Saad Ullah