 Eseandre Mordi

⬤ The S&P 500, tracked through the SPY ETF, keeps trading near recent highs after months of steady gains, with the index sitting around 680 on the daily chart. Even with the overall upward momentum, short-term pullbacks have shown up regularly this year. According to @TrendSpider's analysis, these dips have often lined up with the McClellan Oscillator falling below -25, signaling brief periods of market breadth weakness.
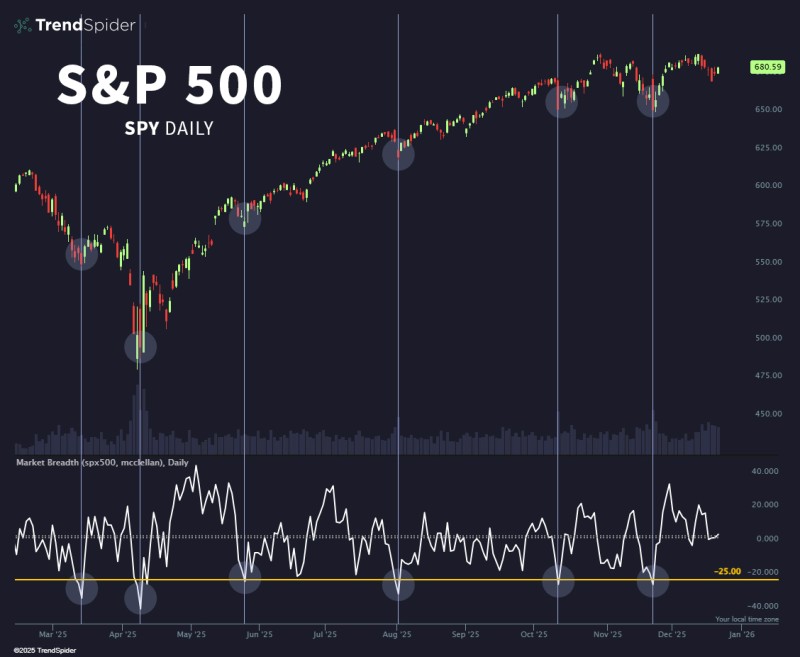
⬤ The chart shows several instances where the McClellan Oscillator dipped into negative territory while SPY experienced temporary declines. Each time this happened, it marked a local bottom before the market rallied again. These moments reveal a consistent pattern where oversold breadth conditions appeared but didn't break the broader uptrend. Price action kept making higher highs and higher lows throughout.
⬤ Volume patterns tell an interesting story during these pullbacks. Some dips came with heavier trading activity, pointing to short-term distribution rather than serious selling pressure. But the downside never gained real traction, and SPY bounced back quickly after each breadth-triggered drop. Those McClellan readings below -25 reflected temporary internal stress, not a breakdown in the overall market direction.
⬤ This pattern matters because market breadth often shows what's happening beneath the surface that headline index numbers don't reveal. The repeated bounces after McClellan dips suggest recent declines have been normal corrections, not trend changes. With the S&P 500 still near record levels, watching these breadth indicators could help traders understand volatility, spot buying opportunities on pullbacks, and gauge how resilient this trend is heading into early 2026.
 Eseandre Mordi


