 Eseandre Mordi

A decisive repositioning is unfolding beneath the surface of the stock market. Data tracking hedge fund flows shows a sharp wave of net selling over the past six weeks, pushing activity toward levels previously seen during periods of market stress. As Neil Sethi noted, the scale of selling now ranks among the largest of the past decade, approaching extremes seen during early 2020.
The Hedge Fund Flow Shock That Stands Out in SPY
The left chart highlights trailing six-week net flows in U.S. equities, with recent readings dropping toward the lower extreme band. Historically, only a handful of periods have reached similar levels - most notably during major stress phases. The current move sits near those extremes, underscoring how quickly positioning has shifted.
Only a handful of periods have reached similar flow levels - most notably during major stress phases - and the current move sits near those extremes.
SPY Tests $644-$645 Support as 2 Volatility Holes Signal More Downside captured the price-level consequences of this positioning shift, showing how the flow pressure has been translating directly into support failures across key technical zones.
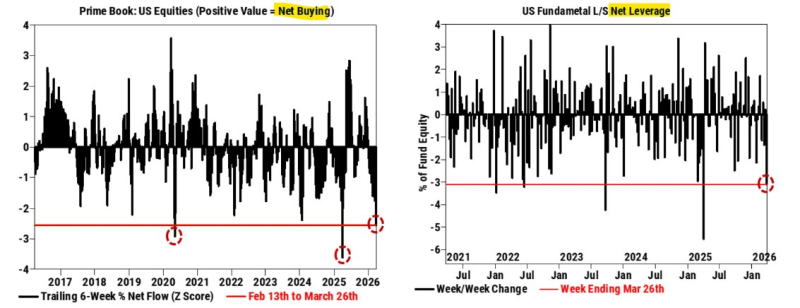
Leverage Is Being Cut, Not Just Rebalanced
The right chart shows U.S. fundamental long/short net leverage declining by roughly 3.1 percentage points in a single week - the sharpest drop since a prior stress event. This is a critical distinction from routine rebalancing:
- A reduction in gross exposure, not just directional shifts
- Simultaneous unwinding of long positions and risk
- A rapid contraction in portfolio leverage
SPY Faces $657 200-Day MA Test as 8-Day EMA Rejections Mount tracked the technical deterioration running alongside this leverage unwind, showing how the two dynamics have been reinforcing each other as the selloff deepens.
When Hedge Fund Positioning Starts Driving the SPY Market
The combination of extreme selling and falling leverage creates a structural shift in the stock market trend. When hedge funds reduce exposure at this scale, liquidity dynamics change - markets become more sensitive to flows, with sharper moves in both directions as positioning resets.
The chart suggests the market is entering one of those phases where positioning - not fundamentals - plays the dominant role in determining short-term direction.
Once positioning changes this quickly, the market rarely returns to a steady trend immediately - it transitions into a phase where volatility, not direction, becomes the defining feature.
SPX Holds 40-Week Reset Cycle With 10-12% Pullbacks Repeating Since 2022 provides historical context for how these de-risking episodes have resolved in recent cycles - and whether the current selloff fits the pattern of a reset within a trend or something more structurally significant.
Extreme selling can precede further downside, but it can also mark points where markets begin to stabilize. What the data confirms is a reset in risk appetite. Once that reset runs its course, the market rarely snaps back cleanly - it moves into a period where volatility defines the tape far more than any directional bias.
 Eseandre Mordi


