Sergey Diakov

The S&P 500's recent momentum streak has officially ended, with SPY halting after seven consecutive gains - the longest run in almost a year. As Barchart reported, the shift comes just as price approaches a key resistance zone, signaling a potential pause in the current stock market trend rather than a confirmed reversal.
SPY Rally Stalls After 7 Sessions at $675-$680 Resistance
The chart shows SPY recovering sharply from late-March lows near the $630 area, followed by a steady climb into the $675-$680 range. This move formed a short-term sequence of higher highs and higher lows, reflecting strong upside momentum during the streak.
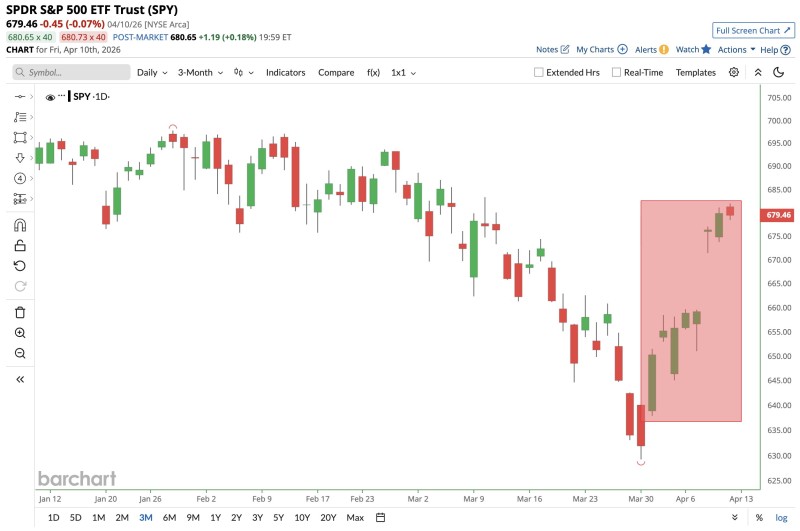
However, the advance stalled just below a visible resistance band near $680. This area aligns with prior price congestion, where earlier attempts to move higher were rejected. The latest candles show hesitation, suggesting that sellers are becoming active again at this level.
The streak didn't simply end - it ended exactly where technical pressure historically builds.
This context is critical for anyone tracking SPY's short-term structure. A pause at resistance after seven straight sessions up is not random - it reflects a well-established pattern in how price behaves at contested levels.
SPY Recovery Still Playing Out Within a Larger Decline
While the rally was strong, the broader structure still reflects recent weakness. SPY continues to show a prior downtrend from February into March, meaning the current move is still a recovery within that larger decline.
Price has not yet reclaimed earlier highs closer to the $690-$695 zone, which remains the next major barrier.
SPY Momentum Signals Show Exhaustion After Multi-Day Advance
The most recent candles near the top of the move show reduced strength, with smaller bodies and signs of rejection. After a rapid multi-day advance, this kind of slowdown often reflects exhaustion rather than continuation.
Dip-buying signals that emerged earlier in the recovery phase helped fuel the seven-day run, but those conditions no longer carry the same weight once price reaches a contested resistance zone.
What Traders Are Watching Next
With the winning streak now broken, attention shifts to whether SPY can hold its newly established short-term structure. Key levels to monitor:
- $670-$675 - holding above this range preserves the pattern of higher lows and keeps the recovery intact
- $680 - the immediate resistance zone where the streak ended; a clean break above would shift the tone
- $690-$695 - the next major barrier and the level needed to challenge the broader downtrend
A break below $670 could signal that the recent rally was only a temporary rebound within a broader corrective phase. Analysts tracking SPX have noted that a pullback before any sustained mid-year rebound remains a realistic scenario.
For now, the S&P 500 remains at a technical inflection point - where momentum has paused, but direction has not yet been decided.
 Sergey Diakov