Eseandre Mordi
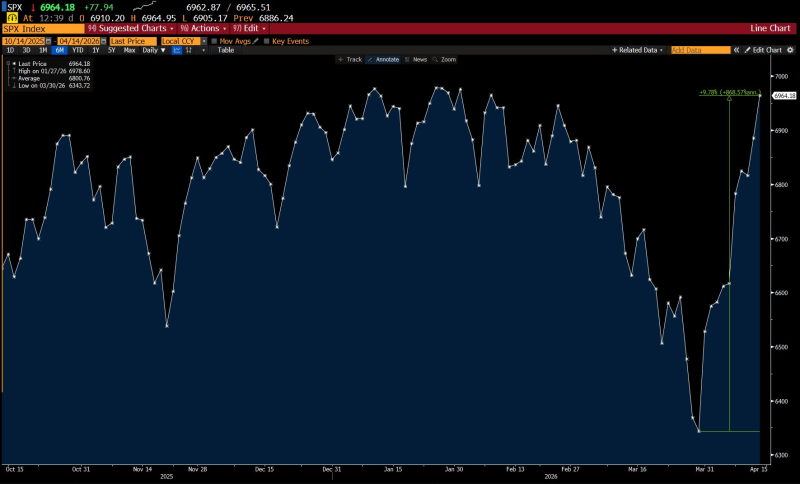
The S&P 500 has staged a sharp rebound and is now trading just below its all-time closing high, completing a near full recovery from a recent selloff in a matter of days. As Jim Bianco noted, the speed of the move - roughly 10% in just 10 trading sessions - has shifted market structure back toward the highs and put the index at a critical decision point.
The SPX Rally That Recovered the Entire Decline
The S&P 500 is now less than 14 points away from its prior all-time closing high set on January 27, 2026. The chart reflects that move with clarity: after falling into late March toward the 6,300-6,400 region, the index reversed sharply and climbed back toward the 6,950 area.
The recovery appears almost vertical, with minimal pauses - indicating strong upward momentum over a compressed timeframe. The green annotation on the chart highlights this acceleration, showing approximately 10% gained over just 10 trading days, one of the fastest rebounds in the recent structure.
An SPX Range Reclaimed in Record Time
What stands out is how quickly the index moved back into its prior range. The chart shows repeated oscillations between roughly 6,700 and 7,000 over the past six months, forming a broad consolidation band. The recent decline briefly pushed price toward the lower boundary near 6,300 - but the rebound has now fully reclaimed the range, bringing the index back to the upper boundary.
The structural picture is clear:
- A rapid recovery from the lower range zone
- Re-entry into the established consolidation band
- Price now pressing against prior highs near 6,950-7,000
SPY Climbs Back as S&P 500 Erases 1% Loss captured the character of the intraday recoveries that have been defining this rally phase, showing how quickly the index has been absorbing selling pressure and reversing - a pattern that compounded session by session into the 10% move now visible on the chart.
The Signal at the Top of the SPX Range
With price now approaching the previous high, the focus shifts to how the market reacts at this level. The prior peak represents a clear reference point where the index previously stalled - and the current structure shows no meaningful resistance between the recent lows and the highs, meaning the move has been a direct push into this zone.
Over 60% of S&P 500 Stocks Are Beating the Index in 2026 adds the breadth dimension to the recovery story, showing that the 10% surge has been driven by broad participation rather than a handful of mega-cap names - which typically makes recoveries more durable than narrow rallies driven by a few stocks.
SPX at 6,624: S&P 500 Eyes Pullback Before Mid-Year Rebound provides context from an earlier point in the recovery arc, showing how the structural setup was already pointing toward a return to the highs before the final 10-day acceleration completed the move.
The index has already completed the recovery phase and is now testing whether it can extend beyond the prior high or pause after the sharp advance. At 14 points away from a new all-time closing high, the answer will come quickly.
 Eseandre Mordi