 Saad Ullah

⬤ S&P 500 market breadth has made a strong comeback in 2026. Over 60% of SPX constituents are now outpacing the index's benchmark returns year to date - putting 2026 among the stronger breadth readings in recent history. Historically, that kind of broad participation doesn't come around all that often.
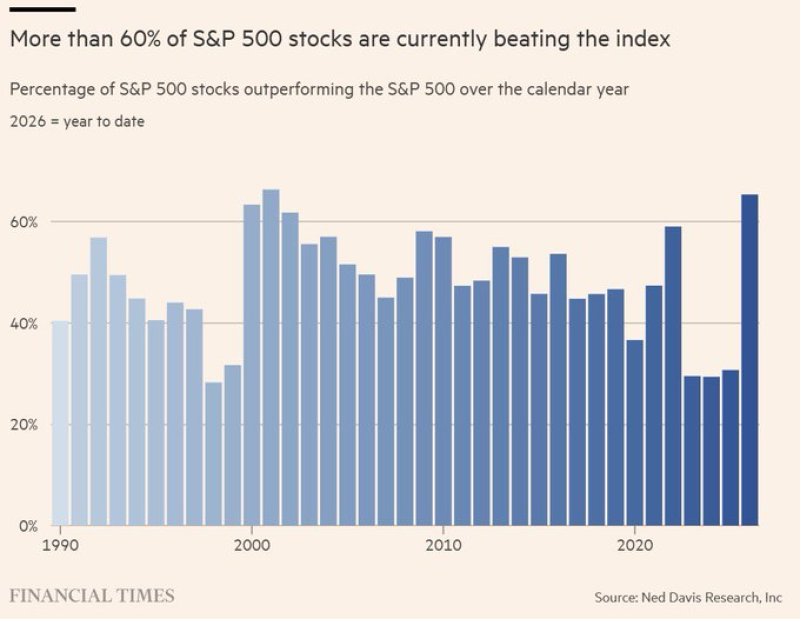
⬤ The data comes from a Ned Davis Research chart presented by the Financial Times, tracing breadth all the way back to 1990. It paints a clear picture: some years delivered wide participation, while others were dominated by a small cluster of mega-cap names carrying the index on their shoulders. The current reading above 60% stands out as a meaningful departure from those narrower stretches.
When more than 60% of stocks outperform their benchmark, it can indicate greater confidence in broader economic and earnings conditions across sectors.
⬤ Broad participation tends to signal something healthier going on beneath the surface. When the majority of SPX stocks outperform the index, smaller and mid-caps are typically gaining ground alongside the big names - rather than lagging while a few high-growth giants do all the heavy lifting. That's a very different dynamic from what investors got used to in recent years. A separate indicator supports this shift - 12.5% of S&P 500 stocks recently hit 52-week highs, the highest reading in over a year.
⬤ What makes this breadth expansion worth watching is what it says about the market's internal mechanics. Gains aren't concentrated in a few leaders anymore - they're more distributed across sectors and market caps. The SPX has also shown resilience at the index level, with SPY recently erasing a 1% intraday loss - reinforcing the idea that the rally has more support underneath it. Whether this breadth holds through the rest of 2026 will be one of the key factors shaping how sustainable the overall SPX advance really is.
 Saad Ullah


