 Marina Lyubimova

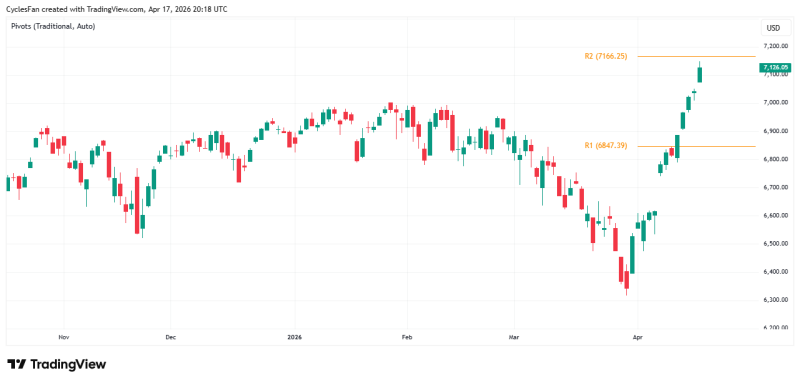
The S&P 500 is pushing into a critical resistance zone after one of its strongest short-term runs in recent memory. CyclesFan pointed out that SPX logged 12 up days in the last 13 sessions, printed a new high near 7147, and is now closing in on the 7166 area marked on the chart as monthly R2. That kind of consistency over such a short window is rare, and it raises an obvious question: does the index have enough left to push through, or is a pause coming?
SPX logged 12 up days in the last 13 sessions, printed a new high near 7147, and is now pressing directly under monthly R2 at 7166.
The Breakout That Reclaimed Prior SPX Peak
The chart tells a clean story. Price reversed sharply from the late-March to early-April decline and then climbed in a near-uninterrupted sequence through mid-April. The index recovered from the low-6300s, reclaimed the 6800 area, broke through the prior all-time-high zone around 6978 - 7000, and pushed on to fresh highs near 7147.
That sequence matters structurally. The breakout above 6978 - 7000 changed the picture. That former ceiling now sits below current price, which supports the idea that the previous ATH zone could start acting as support if the index pulls back from here. S&P 500 Rejected at 7000 After Opening Gap covered exactly this dynamic - how SPX reacts when it runs into a major resistance zone after an extended move.
Why 7166 Is the Immediate SPX Decision Point
The chart marks R2 at 7166.25, just above the latest high. Price is now a short distance below that level after an extended move with very little retracement along the way. That leaves the market pressing into resistance while already stretched from the speed and length of the rally.
- SPX has rallied 12 times in 13 sessions
- The prior ATH zone at 6978 - 7000 has been broken
- The recent high sits around 7147
- Monthly R2 near 7166 is the next resistance area on the chart
That makes 7166 the level the market has to prove itself against. The condition is also narrow: as long as SPX does not close above 7166, a pullback next week stays on the table. SPX Price Analysis: S&P 500 Eyes 6,970 Resistance as New ATH Target Emerges captured a similar setup - SPX breaking toward prior highs and needing a decisive close to confirm the move.
As long as SPX does not close above 7166, a pullback next week remains a realistic scenario given how little the index has retraced during this run.
Where SPX Support Could Reappear on Any Pause
One detail worth noting: the chart does not show a breakdown, hesitation pattern, or reversal candle yet. What it shows is momentum still carrying upward into resistance. But the farther price runs into a marked pivot level without a decisive close above it, the more likely the market is to pause and test whether the breakout actually holds.
If that happens, the 6978 - 7000 region stands out as the first major support reference. It was the previous all-time-high area and has now been overtaken, which gives it real structural weight. SPY Holds Strong Above $689-$695 Zone as Volume Confirms Breakout shows the same concept in action - former resistance flipping into support after a clean breakout, with volume stepping in to confirm the shift.
 Marina Lyubimova


