 Saad Ullah

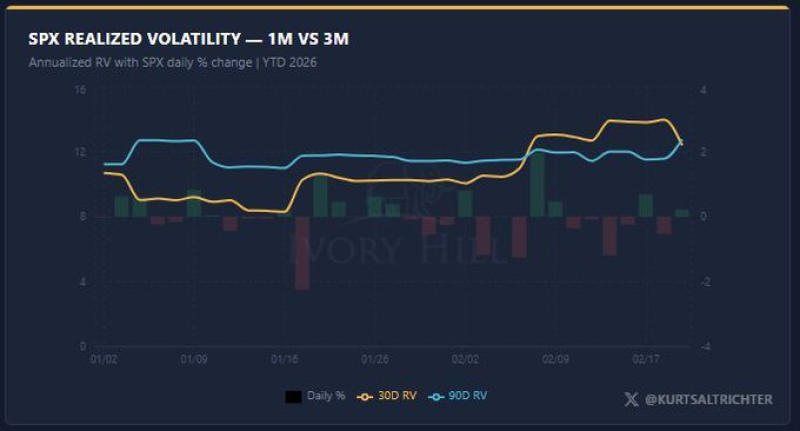
⬤ SPX volatility signals turned calmer in recent sessions. The 30-day realized volatility line has crossed below the 90-day realized volatility line — a crossover visible on the "SPX Realized Volatility – 1M vs 3M" chart for YTD 2026. The yellow 30D RV line eased after an earlier spike and dipped under the blue 90D RV line, signaling that recent SPX daily swings have moderated compared to the broader three-month window.
⬤ Daily SPX percentage changes plotted beneath the volatility lines confirm the same story: near-term variability has genuinely cooled versus earlier 2026. When short-term volatility drops, systematic "machines" can re-lever as modeled risk falls, and volatility-control strategies may increase equity exposure. While the chart doesn't quantify actual flows, the signal lines up with how volatility-targeting frameworks typically respond when the short-term metric falls under the longer-term baseline.
⬤ The SPX setup is being tracked alongside broader positioning and sentiment indicators. Options activity and hedging costs can add useful context when volatility regimes shift. Related reads from TheTradable: S&P 500 Breadth Signal Shows 100% Historical Win Rate, SPX: Put/Call Ratio Jumps to 0.92 — Highest Reading Since June, and S&P 500 Downside Hedge Costs Jump to 46 Basis Points — Highest Since April.
⬤ Realized volatility is a core input for many systematic allocation models tied to the SPX. If the 30D measure stays below the 90D line, it can reinforce a lower-turbulence regime and support the "grind higher" read — but the signal is conditional. One stretch of wider SPX daily moves can flip the picture fast, making upcoming catalysts and volatility shifts the key things to watch.
 Saad Ullah


