 Marina Lyubimova

A rare breadth signal just flashed across the S&P 500, and history says it's worth paying attention to. When close to 20% of stocks in the index hit 52-week highs after a six-month dry spell, the market has never failed to move higher over the next year. That perfect track record stretches back decades, offering a compelling—if not foolproof—case for continued strength.
What the 19.7% Breadth Expansion Means for Markets
Market breadth across the SPX has strengthened as more companies join the advance. 19.7% of S&P 500 stocks reached 52-week highs for the first time in over six months, marking a shift toward broader participation in the ongoing market trend.
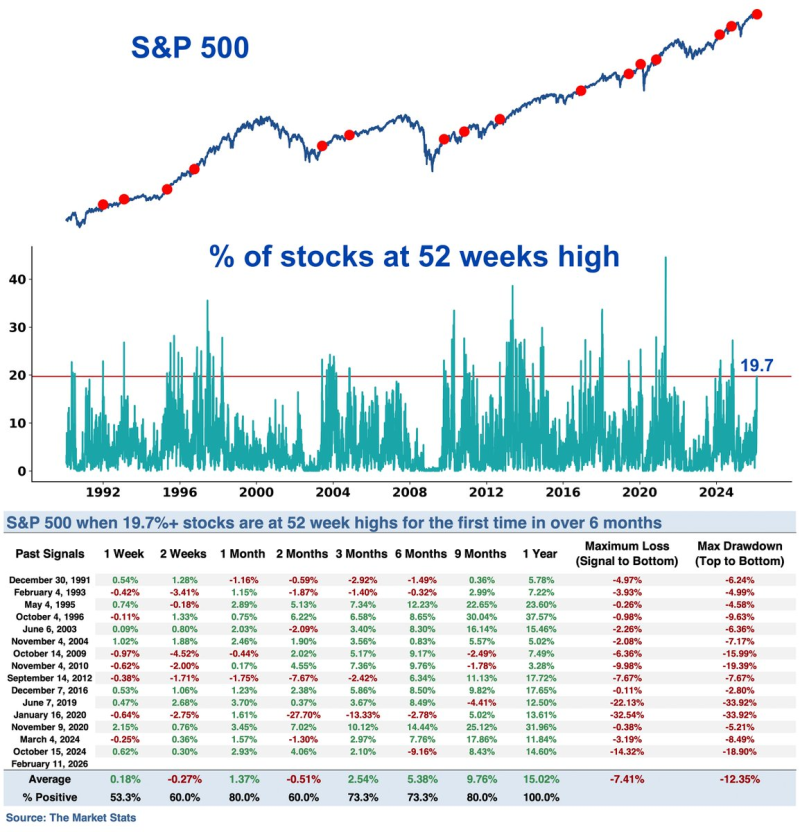
The chart tracks historical signals dating back to the early 1990s and shows similar breadth expansions repeatedly appearing during strengthening phases in the index. In every past instance recorded, the S&P 500 was higher one year later, with an average gain of about 15%. Comparable participation improvements were also observed in S&P 500 breadth hits 200 day milestone.
Historical Win Rate Comes with Normal Volatility
Historical performance also included volatility. The dataset shows the maximum drawdown during the following year averaged approximately 12.3%, indicating advances typically occurred alongside normal market pullbacks rather than uninterrupted rallies. Similar signals tied to expanding participation appeared in 12.5% of S&P 500 stocks hit 52 week highs and broader participation trends in 67% of stocks above the 200 day moving average.
The development highlights how expanding participation often reflects underlying strength within the SPX rather than isolated leadership from a small group of stocks. When a larger share of companies reaches new highs simultaneously, the index historically tends to maintain upward momentum over longer time horizons while still experiencing typical corrections along the way.
 Marina Lyubimova


