 Marina Lyubimova

The S&P 500 is entering a part of the chart where short-term relief and unfinished downside can both exist at once. Weekly momentum has deteriorated sharply, with RSI slipping to 35.5 while MACD and rate of change continue to point lower - yet the index remains well above its 200-week moving average near 5,190. As Alan Cohen put it, the market looks oversold enough for a bounce, even a dead-cat one, but not necessarily washed out enough to declare a final bottom.
Where SPX Selling Has Started to Look Exhausted
The most striking feature on the chart is the cluster of momentum signals approaching levels that previously aligned with major stress points. The weekly RSI is pressing toward the lower band that marked prior downside extremes, while the MACD has rolled decisively lower and the 12-week rate of change has turned sharply negative.
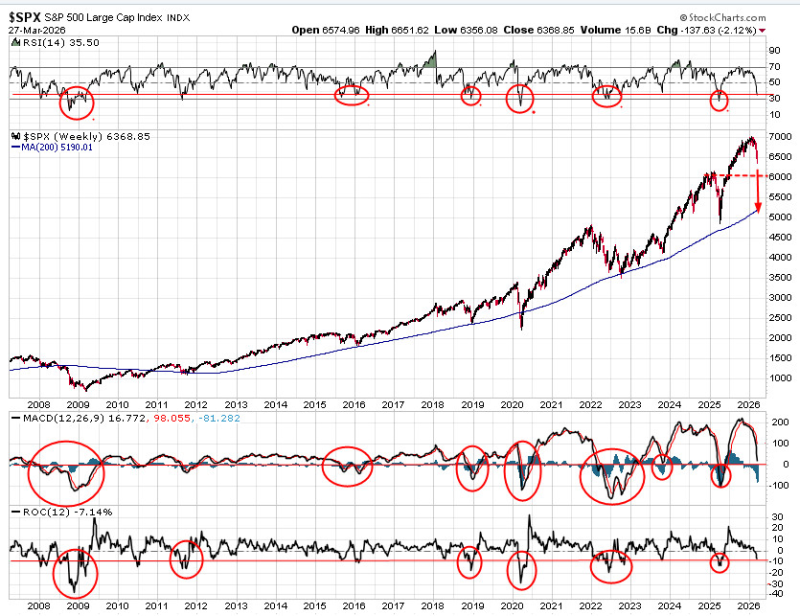
That combination matters because it shows acceleration to the downside - not just a mild pullback. At the same time, prior circles drawn across the chart suggest this is the kind of setup where the index can snap back hard before the larger correction is fully complete.
Oversold does not automatically mean bottomed - it often means the market is vulnerable to a countertrend rally first.
SPY Tests $644-$645 Support as 2 Volatility Holes Signal More Downside captured the pressure building at nearer-term support levels, showing how the deterioration in weekly momentum has been playing out across shorter timeframes as well.
The Space Between 6,000 and the 200-Week SPX Average
Price is still trading comfortably above the 200-week moving average near 5,190, so calling that level an immediate destination would be premature. But it stands out as the deeper structural support that would come into focus if the correction keeps broadening.
Before that, the 6,000 area looks like the more realistic first test. It sits much closer to current price and fits the idea that the market may not need to fall all the way to the long-term moving average to find a workable bottom.
SPY Faces $657 200-Day MA Test as 8-Day EMA Rejections Mount tracked the earlier stages of this moving average breakdown sequence, providing context for how quickly key levels have been giving way during the current decline.
Why Any SPX Rally Still Has to Prove Itself
The bigger trend has clearly lost momentum. After pushing to fresh highs, the S&P 500 has turned lower and the weekly chart is now behaving more like a correction than a routine dip. That means any rebound from here has to be judged by character, not just by size.
A fast bounce would fit the oversold setup - especially with sentiment and momentum already stretched. But unless that rebound starts repairing the weekly structure, it would still look more like relief than resolution.
SPX Signals Final Bull Run as 16-Year Cycle Nears Its Peak places the current correction within a much longer structural context - raising the question of whether any bounce from oversold conditions is a buying opportunity or simply the last relief rally before a more significant turning point.
The chart leaves room for both scenarios: a rally born from exhaustion, or more selling that drags SPX closer to a more durable bottoming zone. For now, that tension is what defines the tape.
 Marina Lyubimova


