 Marina Lyubimova

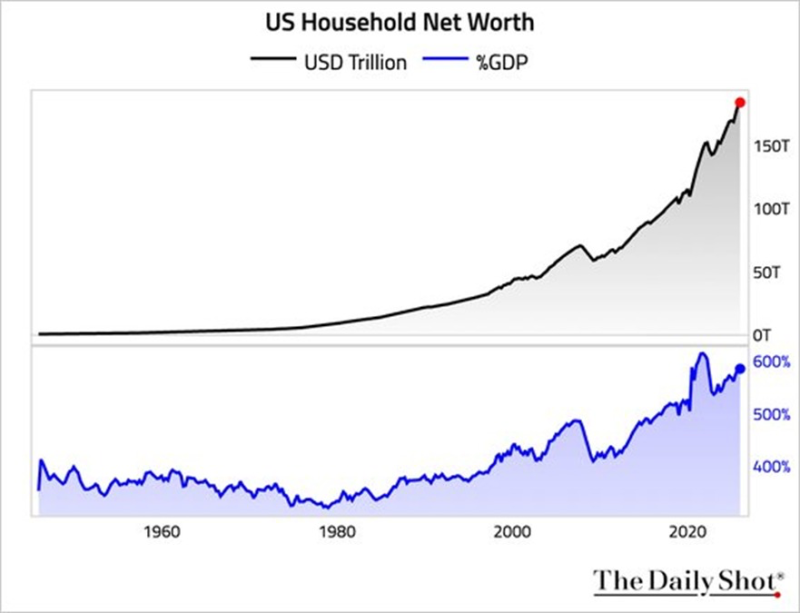
U.S. household wealth has reached a new record, extending a powerful multi-year uptrend fueled largely by equity market gains. The latest data shows a continued expansion in net worth, with stock market performance playing a central role in the increase.
The Trend That Keeps Printing New US Wealth Highs
The chart shows a persistent upward trajectory in household net worth, with acceleration clearly visible after 2020. The structure is defined by consistent higher highs, with no sustained breakdowns interrupting the broader trend.
In Q4 2025, net worth rose by $2.2 trillion to $184.1 trillion - marking yet another extension of the cycle. The move fits into a longer pattern where gains continue to build on prior highs rather than reverse, reinforcing the strength of the underlying trend.
As The Kobeissi Letter noted, this dynamic reflects how strongly household wealth is now tied to financial assets rather than broader components of net worth.
Where S&P 500 Equity Gains Drive the US Wealth Expansion
The composition of the latest increase highlights a clear imbalance. Equity holdings added approximately $1.6 trillion during the quarter - accounting for the majority of the $2.2 trillion gain - while real estate declined by $347 billion.
This divergence underscores the dominant role of equities in shaping the current structure. As stock market levels remain elevated, they continue to translate directly into higher aggregate wealth while other asset classes contribute far less to the overall picture.
SPY Jumps 0.5% as Core PCE Inflation Falls to 2.8% shows the kind of session-level equity gains that compound into the quarterly wealth figures - reinforcing how directly S&P 500 performance flows through into the household balance sheet data.
A US Wealth Structure Near Historical Extremes
The chart also shows how extended the current cycle has become relative to historical benchmarks. Household net worth now stands at roughly 586% of GDP, approaching the previous peak near 620% reached in 2021. Net worth as a percentage of disposable income has climbed to 794% - marking one of the highest readings on record.
Net worth at 586% of GDP and 794% of disposable income places the current cycle near the upper bounds of its historical range - the trend remains intact, but the extension is significant.
U.S. Wealth Data: Top 10% Control 87% of Stocks and Major Assets adds an important distributional dimension to the headline figure - showing that the $184 trillion in aggregate wealth is heavily concentrated, with equity-driven gains disproportionately benefiting a narrow slice of households.
S&P 500 Sheds $3.1T in Three Weeks After Hitting October Peak provides the counterpoint - showing how quickly equity-driven wealth can reverse when markets turn, reinforcing why the concentration of net worth in financial assets creates vulnerability alongside the gains.
The structure shows no clear signs of reversal - only continued expansion driven primarily by equities. As long as stock market strength persists, the trend in household wealth remains tilted to the upside, keeping gains concentrated among asset holders at historically elevated levels.
 Marina Lyubimova


