 Marina Lyubimova

⬤ The S&P 500 just took a pretty hard hit after reaching its highest-ever market cap at the end of October. The index hit a record $61.4 trillion on October 28-29, then slipped to $61.0 trillion by month's end and kept sliding to $58.3 trillion as of November 20. That's a 5.1% drop, wiping out roughly $3.14 trillion in total market value in just over three weeks.
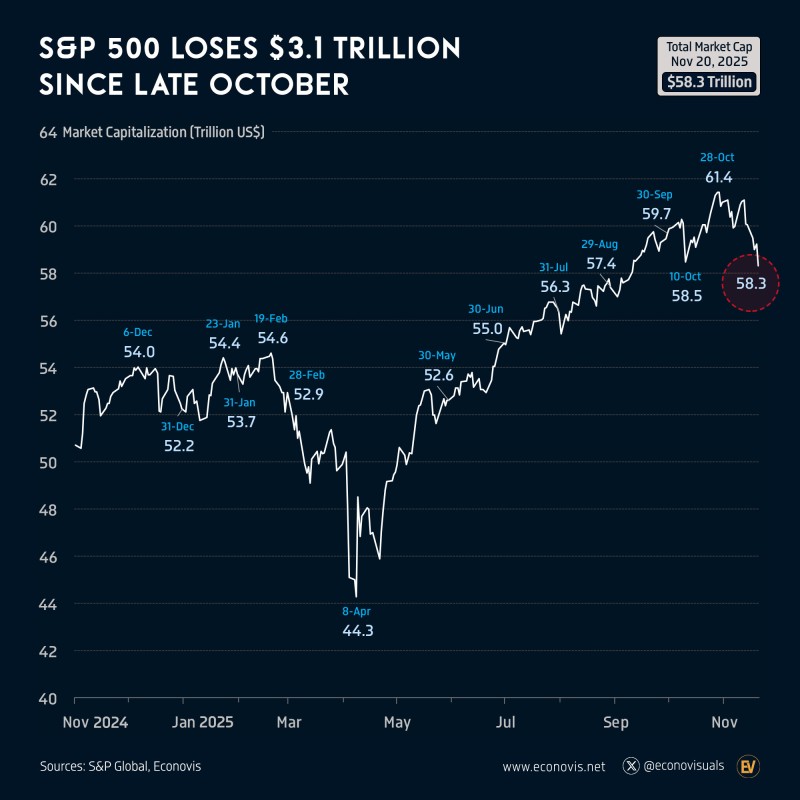
⬤ The chart shows this pullback comes after a solid rally that kicked off in early April, when the S&P 500 was sitting near $44.3 trillion. From there, the index kept climbing steadily, bouncing back to $52.6 trillion by late May and pushing higher through summer. It hit $56.3 trillion at the end of July and kept grinding toward that late-October peak.
The S&P 500's total market capitalization provides a key measure of equity-market strength, liquidity conditions, and macroeconomic expectations.
⬤ This recent drop marks the sharpest short-term correction since spring's sell-off, breaking what had been a pretty strong upward run through most of 2025. The chart makes it clear—there's a definite turn downward after those October 28-29 highs. Still, the S&P 500 is up 11.6% year-to-date, adding $6.1 trillion in market value since January. So despite the recent shake-up, the index is hanging onto most of the gains it racked up earlier this year.
⬤ A drop of more than three trillion bucks definitely matters. It can shake up risk sentiment, mess with portfolio positioning, and crank up volatility across global markets. While the bigger uptrend is still holding, this pullback shows markets are getting more sensitive to changing economic conditions. Investors might be in for more adjustments as everyone takes another look at valuations after such a long winning streak.
 Marina Lyubimova


