 Eseandre Mordi

NASDAQ is continuing its upward movement inside a well-defined channel, with price advancing steadily toward the 26,200–26,450 resistance zone. According to Forex Sinyal Merkezi, the structure also reflects a flag-like consolidation within the broader trend - pointing toward continuation rather than reversal.
Price is now sitting near the upper boundary of this formation, where channel resistance and horizontal resistance converge. That makes this area the immediate technical ceiling for the current move.
NASDAQ momentum indicators signal overbought conditions
RSI is currently running in the 79–82 range - firmly in overbought territory - which raises the probability of a near-term correction. Volume also tells a similar story: it was strong early in the rally, but recent candles are showing it pull back. That combination, elevated RSI alongside fading participation, is a classic sign of a market that is still moving in the right direction but quietly losing steam under the surface.
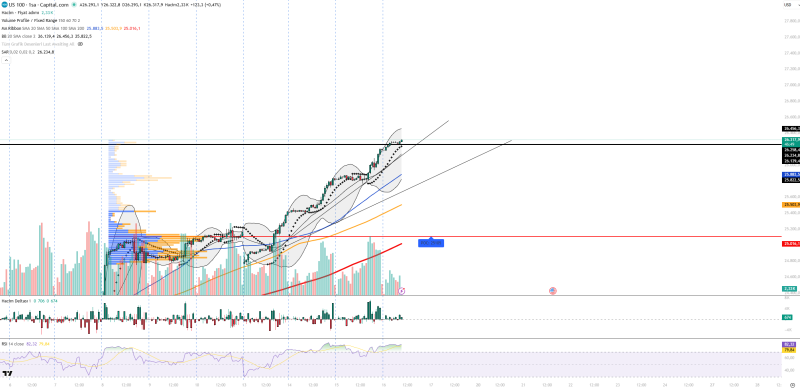
Bollinger Bands confirm this - price is touching the upper band, which signals strong trend conditions but also increased tension. The Parabolic SAR remains below price, reinforcing that the broader uptrend is still intact. A comparable setup was visible in NASDAQ Price Analysis: Index Tests Key 25,000 Resistance After Rebound From 24,500, where price ran into a critical ceiling after a sharp recovery phase.
25,100 anchors the NASDAQ structure as the key support floor
The chart identifies 25,100 as the main support level, derived from the volume profile point of control. This represents the area where the most volume has accumulated - making it the structural base that anchors the whole setup.
Support and resistance levels currently in play:
- Support levels: 25,100 (main), 25,880, 26,130
- Resistance levels: 26,200–26,450 (current zone), 26,800, 27,200, 27,600
- Volume delta: remains positive - buyers still hold the upper hand overall
Similar dynamics played out in NASDAQ Price Analysis: Rally Faces Key Resistance at 24,900 and in NASDAQ Stalls at 25,100 as Range Tightens Between 24,650 and 25,100 - both cases showed how resistance zones and narrowing ranges tend to build pressure ahead of a directional move.
NASDAQ uptrend intact, but the setup is getting stretched
The trend has not broken. Indicators across the board still support the upside case. But the index is clearly becoming stretched the higher it goes, and the setup is starting to price in a higher probability of a short-term correction.
NASDAQ is not showing signs of reversal yet, but the probability of a short-term pullback is increasing as price tests resistance at the 26,200–26,450 zone.
What happens next depends on one thing - whether price can break cleanly above resistance, or whether these overextended conditions trigger a corrective phase within the broader uptrend.
 Eseandre Mordi


