 Usman Salis
The European Union's trade picture in 2025 is one of those setups where the headline number understates what's actually going on underneath. Yes, the overall goods trade balance slipped by €8 billion compared to 2024. But the more interesting story is the split: one sector doubling over a decade while another continues to act as a ceiling on any real recovery.
EU_Eurostat published the latest breakdown, and what it shows is a trade structure that has partially healed from a major shock, but hasn't fully restored itself.
EU Trade Balance Still Recovering From the 2022 Structural Break
To understand where things stand now, you have to go back to 2022. That's when the balance collapsed from modest positive territory into a steep deficit, driven largely by the energy crisis. It wasn't a routine pullback. It was a full reset of the structure that had held broadly stable from 2015 through 2021.
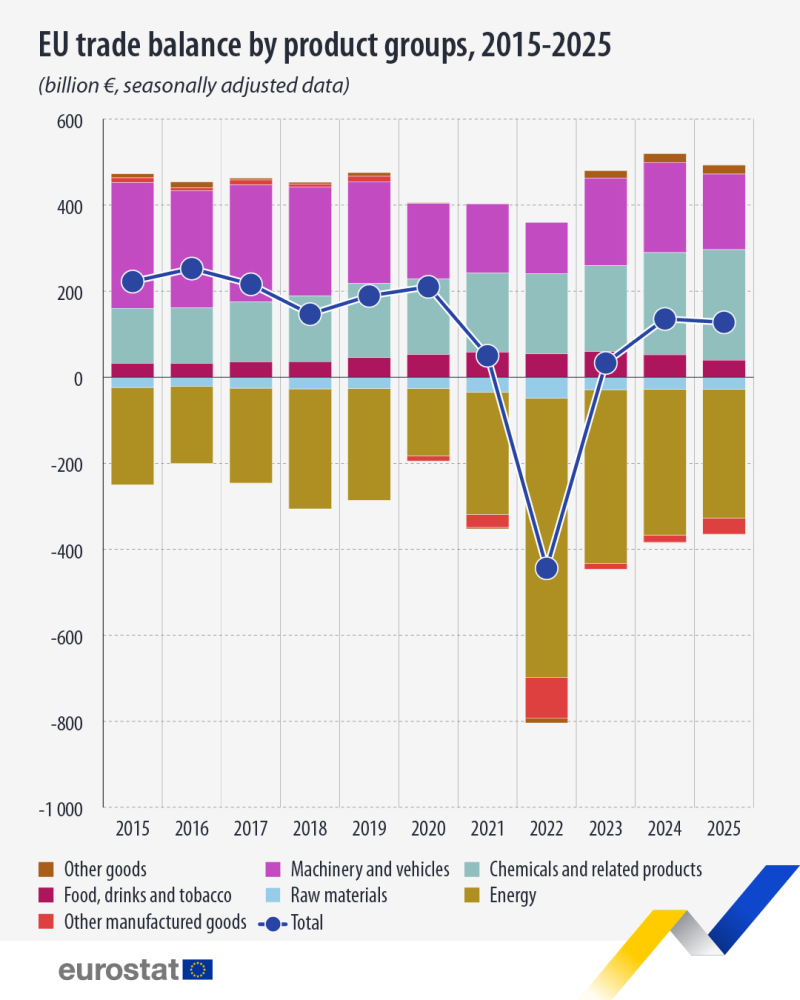
The rebound since then has been real. The balance recovered from that deep deficit to a moderate surplus by 2024-2025. But it still sits below the stronger readings from the pre-2022 period. In technical terms, this looks like a sharp breakdown followed by an incomplete retracement, recovering without fully regaining prior highs.
The EU has recovered from the 2022 dislocation, yet the recovery still looks uneven, with chemicals doing more of the lifting and energy continuing to weigh on the broader balance.
That kind of partial recovery matters for anyone tracking ECB rate expectations and broader European macro conditions. The structure has improved, but it hasn't normalized.
EU Chemicals Sector Doubles to €256.7B While Trade Breadth Narrows
The most constructive data point in the release is chemicals and related products. This category climbed from €128.3 billion in 2015 to €256.7 billion in 2025, the largest increase of any sector over the decade. Machinery and vehicles remain a positive contributor, but chemicals have increasingly become the cleaner long-run strength story.
The EU is not losing competitiveness everywhere at once, but the leadership profile is narrowing, and that is often a more fragile kind of strength.
That narrowing breadth is worth flagging. When fewer sectors are carrying the load, the overall balance becomes more sensitive to stress in any one of them. In market terms, it's the kind of setup that looks stable until it isn't.
Eurostat's own nowcasting work points to increasing sophistication in how these structural shifts get tracked and interpreted, which makes the sector-level reading here more reliable than it might have been in prior cycles.
EU Energy Deficit Keeps Acting as Overhead Pressure on SPY and Global Sentiment
If chemicals are the stabilizer, energy is what keeps capping the recovery. The energy component ran deeply negative throughout the series and became extreme in 2022. Three years later, it's still a significant drag, and that's the structural restraint preventing the overall balance from returning to its earlier shape.
The energy deficit is no longer just a one-year anomaly. It has become a continuing structural weight on the pace of normalization.
This connects directly to the broader European energy story. The EU's ongoing search for alternatives to US LNG reflects the same underlying tension visible in this chart: Europe's energy position remains unresolved, and it continues to shape industrial activity, inflation dynamics, and the pace of any macro recovery.
For investors watching the S&P 500 and global risk appetite, the EU trade balance breakdown reinforces a familiar theme: the surface looks stable, but the structure underneath it is uneven. Chemicals are doing the heavy lifting. Energy keeps the ceiling low. And the €8 billion headline decline in 2025 is less a warning on its own and more confirmation that the recovery, while real, still has structural limits.
 Usman Salis


