Eseandre Mordi

The U.S. Dollar Index (DXY) is showing signs of stabilization after a prolonged decline, with the latest weekly chart pointing to a possible base formation. Analyst Aksel Kibar, CMT flagged the setup, noting that recent consolidation could be setting the stage for a move higher - with a double bottom pattern emerging as the key structure to watch.
The current setup raises the possibility of a double bottom, with recent consolidation potentially acting as preparation for a move higher.
The broader picture shows DXY coming off a sustained downtrend from highs above 110, with price previously tracking a descending channel. That pattern of lower highs is still visible on the chart - but downside momentum has slowed considerably, and the index is no longer making fresh lows.
A Base Forming After Prolonged DXY Weakness
Instead of continuing lower, the index has stabilized in the mid-90s zone, where two comparable lows have developed. That creates the foundation for a possible double bottom - an early signal that selling pressure may be fading and that the market is shifting from distribution to accumulation.
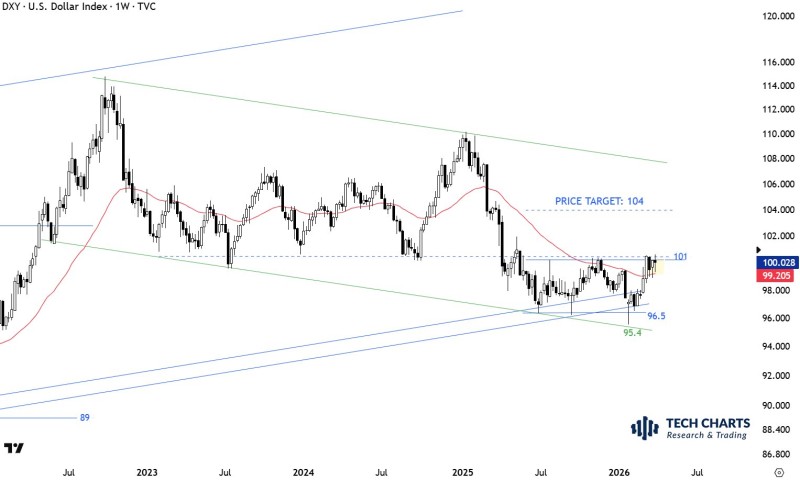
The chart also shows price holding near the lower boundary of a longer-term rising structure, reinforcing the idea that this area is functioning as meaningful support rather than just a temporary pause.
DXY Holds Above the 200-Day Moving Average
One of the more significant developments in recent weeks is how the index has behaved around its 40-week (200-day equivalent) moving average. DXY has managed to hold above this level, which sits just below the 100 mark - a threshold widely used to separate bullish from bearish conditions.
Sustained consolidation above this moving average suggests buyers are actively defending the area. What was previously a zone of resistance is gradually being converted into support - a meaningful structural shift for a market that spent several months in a clear downtrend.
Compression Beneath Resistance, Breakout Targets at 101 and 104
While the floor is holding, the ceiling is doing its job too. The 101 area stands out as immediate resistance on the chart, with a higher target near 104 if a breakout materializes. Price is currently compressing between rising support and horizontal resistance - a structure that frequently precedes a directional expansion.
Resistance near 100-101 continues to define the upper boundary - a level that has repeatedly capped the index in recent periods.
This tightening range is the market's way of saying it is no longer trending lower, but hasn't yet committed to moving higher. The energy is building, and the direction of the eventual resolution will tell traders a lot about where dollar momentum is heading.
What to Watch: DXY Resolution Could Target 104
The key takeaway from the current DXY setup is the transition from decline to consolidation. The index is holding above the 200-day moving average, two comparable lows have formed in the mid-90s, and price is now coiled between support and resistance.
If the index breaks above the 100-101 zone, the 104 region becomes the next meaningful area of interest. Until a breakout is confirmed, the ongoing balance phase keeps traders in a watching mode - with the 100 resistance level serving as the key line in the sand.
A confirmed double bottom at these levels would mark a significant shift in the medium-term outlook for the U.S. dollar.
 Eseandre Mordi