 Saad Ullah

⬤ XRP nears a key support band that has held for multiple years. Weeks of steady selling push the price back to the same long term floor. The level now in view sits at $2.00 and stretches down to $1.80. It contains three overlapping supports - a horizontal line that has stopped every decline since 2017, a thick volume cluster where buyers previously stepped in and the weekly 100-period exponential moving average that rests near $1.86. The live quote hovers at $2.00 as the market edges toward this triple layer.
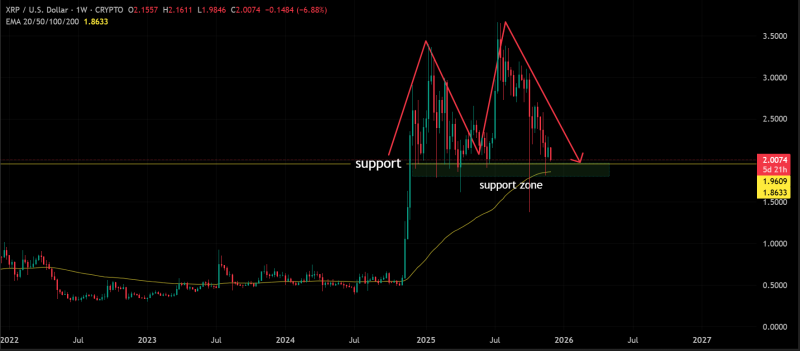
⬤ The horizontal line shows a clear row of weekly lows that have reversed price on every test. The demand block between $1.80 plus $2.00 records the heaviest accumulation in the coin's history. The 100-EMA at $1.86 adds one more safety net. Above the market a possible double top has formed - two equal peaks stand at $2.90 and the neckline lies exactly inside the $1.80-$2.00 support. A weekly candle that finishes beneath $1.80 would complete the pattern and switch the long term bias to negative.
⬤ The importance of the zone is simple - as long as the price closes the week above $1.80 the broader uptrend survives. A close below that level breaks the structure but also invites a deeper decline. The next weekly settlement will decide which outcome prevails.
 Saad Ullah


